
Throughput Utilization
Limitation
Max TPS and Average TPS show incorrect values if the client uses the batch mode for messaging API and Event API requests. This will be fixed in a subsequent release.
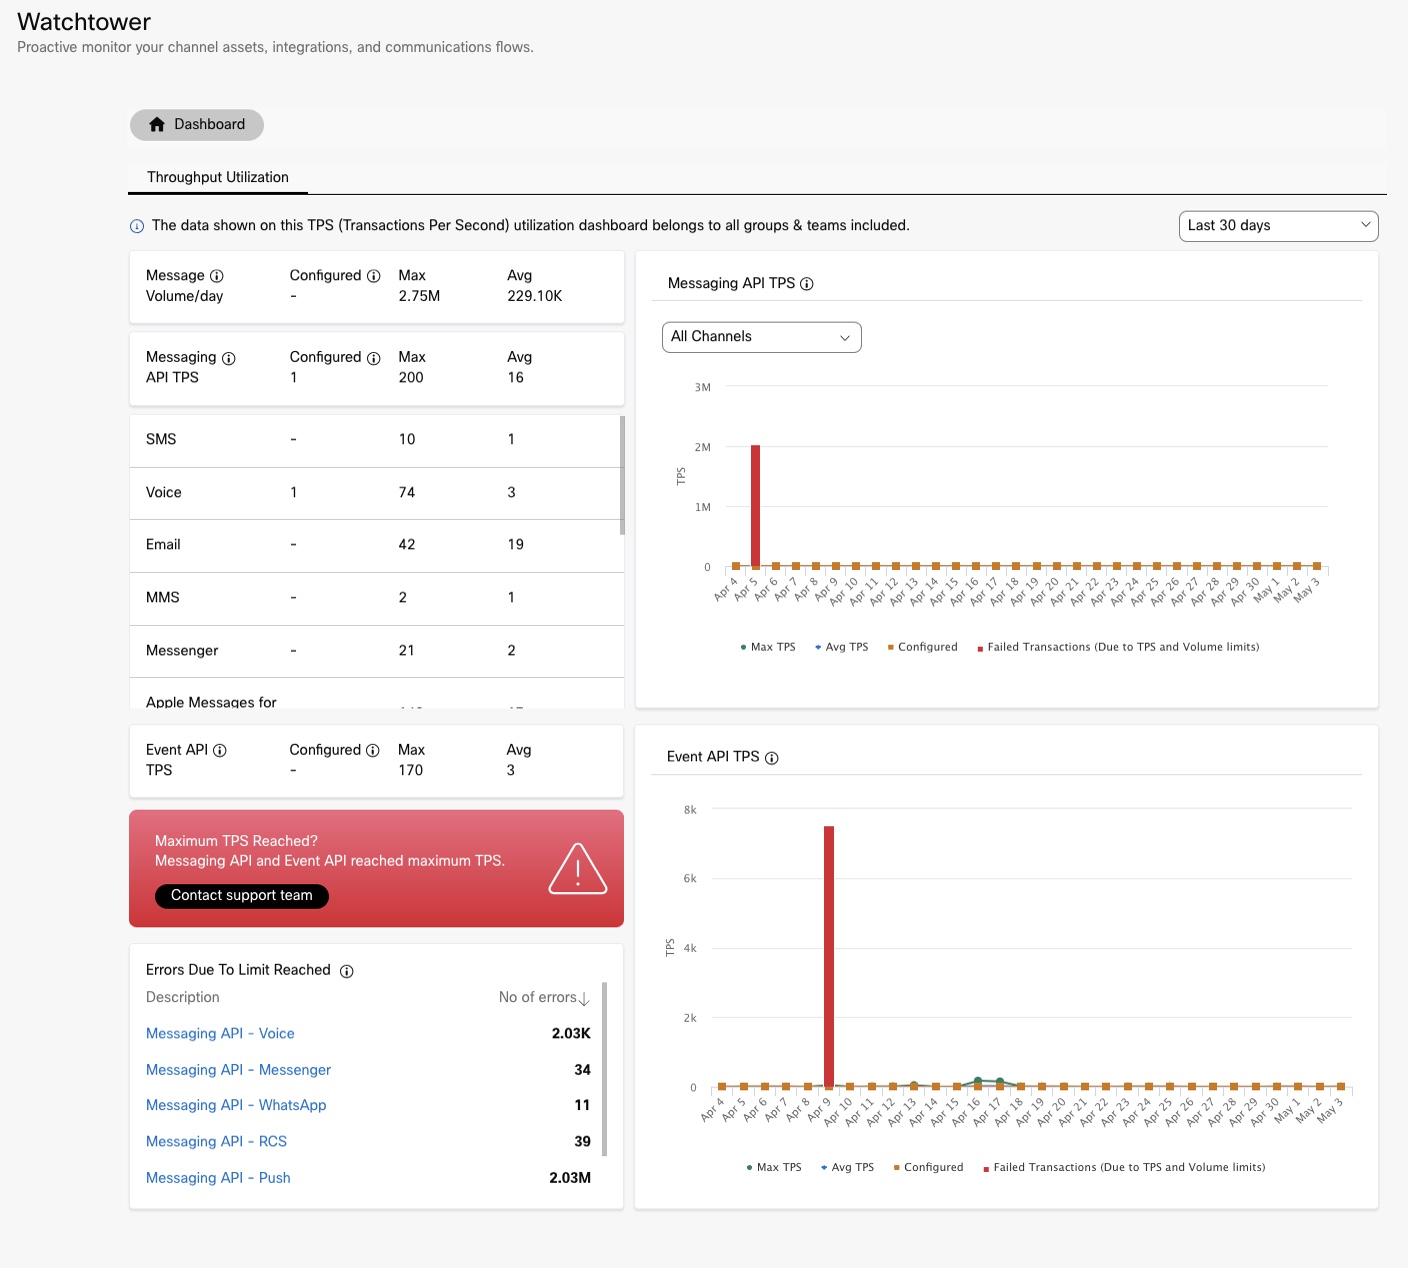
The Throughput Utilization tab shows the usage report of transactions per second for your tenant.
Date Range
Use this option to view the data for a particular day or period. The available options are Today, Yesterday, Last 7 days, Last 15 days, Last 30 days, and Custom. For Custom, you can select a date and time range. By default, the data is shown for 30 days.
Message Volume/Day*
This section shows the information about the message volume for the selected date range or period. Message volume includes inbound and outbound transactions.
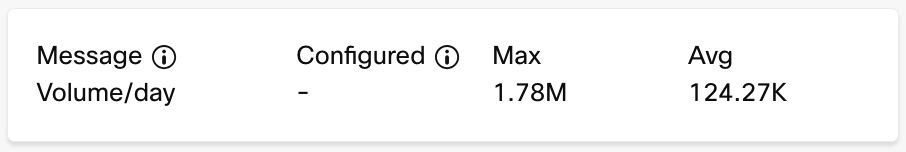
- Configured: Limit of message volume per day* that is configured for your tenant. This field shows ‘-‘ if there is no limit set.
- Max: Highest count of message volume on any day* in the selected date range or period.
- Avg: Total sum of the message volume in the selected date range or period divided by the number of days in the selected date range or period.
Note
*The time period can be day, week, or month based on your contract.
Messaging API TPS
This section shows the metrics about the messaging API transactions per second for the selected date range or period. This includes v1, v2, and v3 APIs. This data helps you monitor the transaction count and identify if you must increase or decrease the TPS limit for your tenant. Reach out to your account manager for more information on TPS limits.
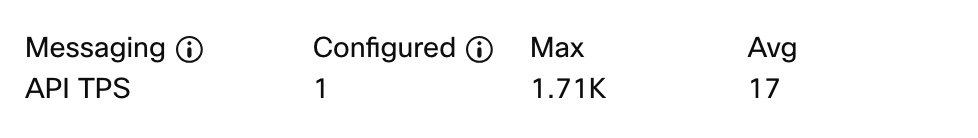
- Configured: Limit of messaging API transactions per second that is configured for your tenant. This field shows ‘-‘ if there is no limit set.
- Max: Highest count of messaging API transactions per second during the selected date range or period.
- Avg: Total sum of the messaging API transactions during the selected date range or period divided by the number of seconds in the selected date range or period.
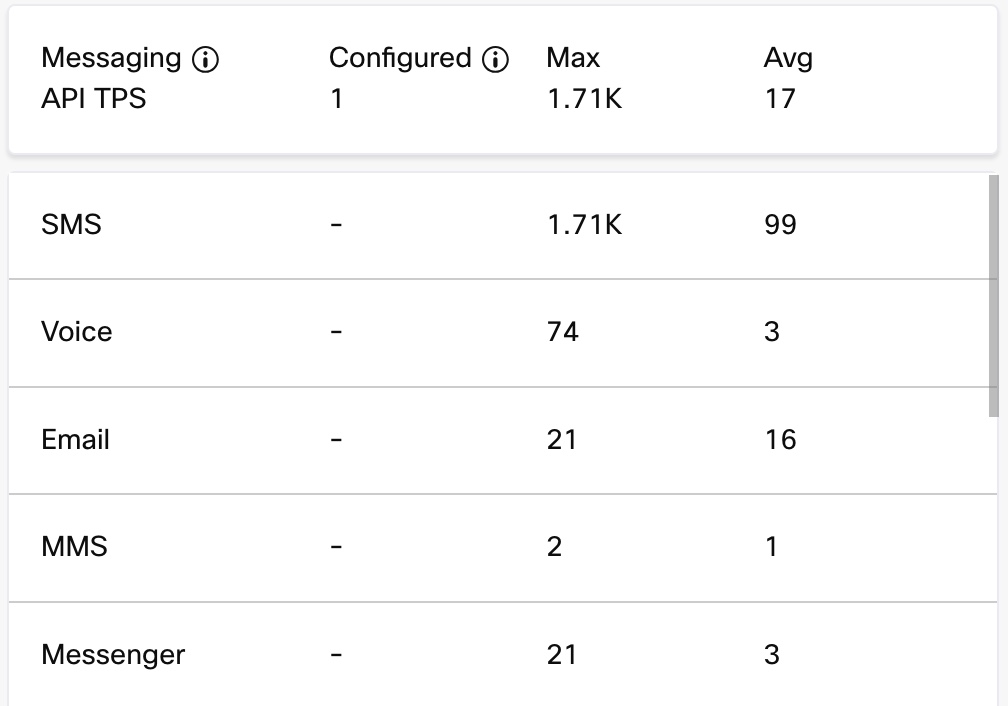
Channel-wise Distribution
This section shows the information about the message API transactions per second for the selected date range or period for each individual channel.
- Configured: Limit of messaging API transactions per second that is configured for your tenant. This field shows ‘-‘ if there is no limit set.
- Max: Highest count of messaging API transactions per second during the selected date range or period.
- Avg: Total sum of the messaging API transactions during the selected date range or period divided by the number of seconds in the selected date range or period.
Messaging API TPS Graph
This section shows the trend line of the information about messaging APIs transactions per second for the selected date range or period. Use the channel dropdown to view the channel-wise data on the graph. You can click the different options such as Max TPS, Avg TPS etc to show or hide the data on the graph.
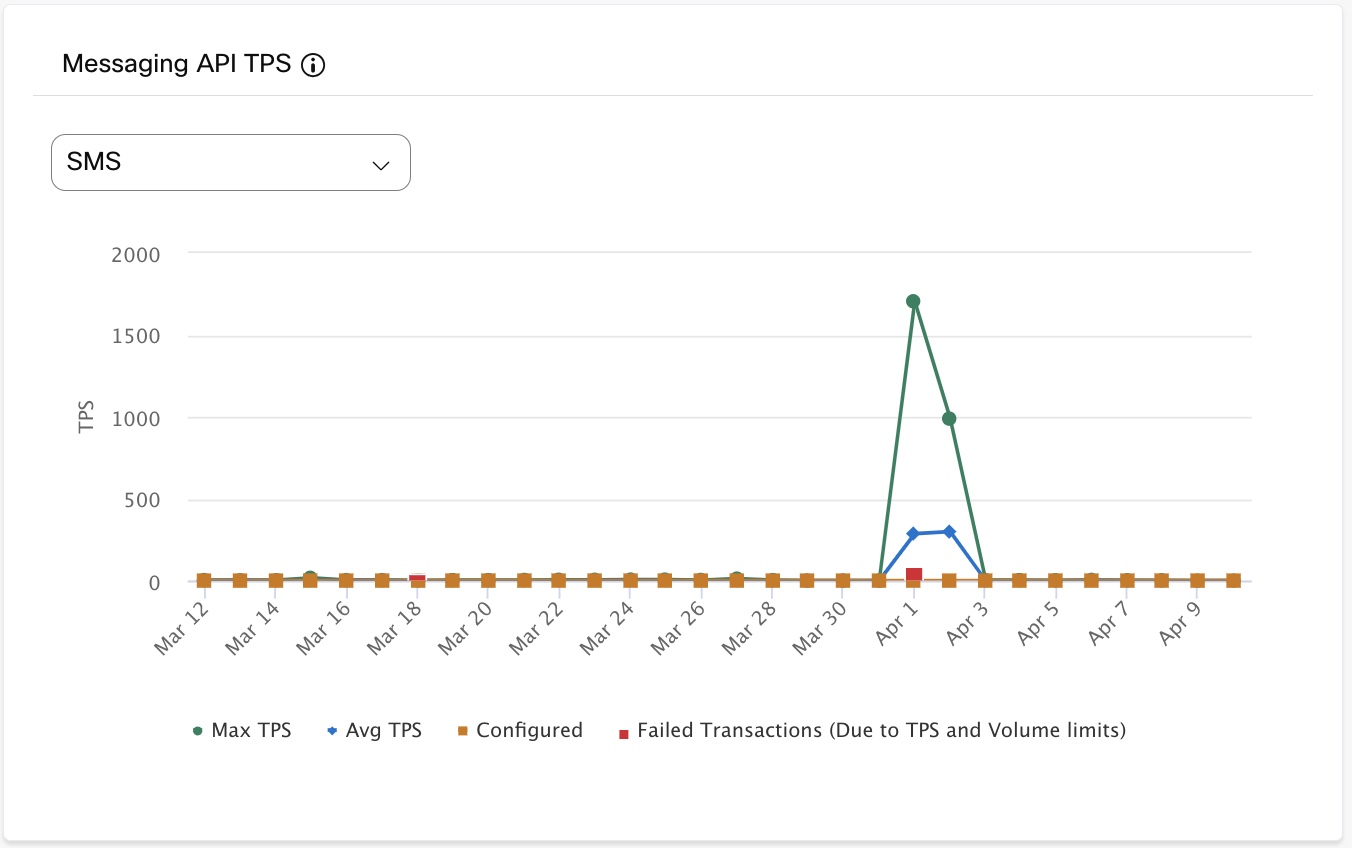
- Max TPS: Highest number of transactions per second.
- Average TPS: Average number of transactions per second for the day / hour / month.
- Configured: Maximum value of the configured transactions per second. For example, if the configured value is changed to 10, 20, and 30 during the day/hour, then 30 will be shown on the graph for that day/hour.
The graph shows the value zero (0) if the TPS is not configured. - Failed Transactions (Due to TPS and Volume Limits): Number of transactions that failed when the TPS and volume limits are reached.
When you select a single day or partial day (Today/Yesterday/Custom) in the Period filter, tthe hour-wise TPS is shown on the graph. When you select multiple days (7 days / 15 days / 30 days / more than one day in Custom) in the Period filter, the day-wise TPS is shown on the graph.
Event API TPS
This section shows the information about the event API transactions per second during the selected date range or period for inbound and custom events.
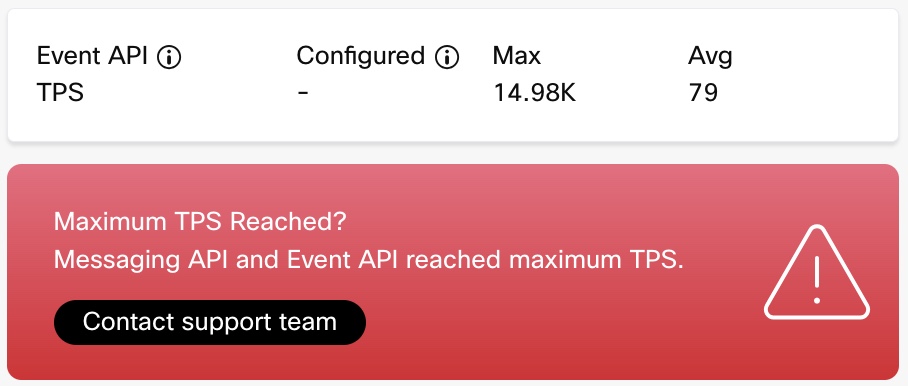
Note
If there are any failures for a selected period, the Maximum TPS Reached? will be shown in Red. If there are no failures, the Maximum TPS Reached? will be shown in Green. Please contact the support team for more information regarding the issue.
Event API TPS Graph
This section shows the trend line of information about the event API transactions per second during the selected date range or period.
- Max TPS: Highest count of event API transactions per second during the selected date range or period.
- Avg TPS: Total sum of the event API transactions during the selected date range or period divided by the number of seconds in the selected date range or period.
- Configured: Limit of event API transactions per second that is configured for your tenant. This field shows ‘-‘ if there is no limit set.
- TPS Failed Transactions: Number of failed transactions.
This graph displays the custom event and inbound webhook TPS APIs for all the channels.

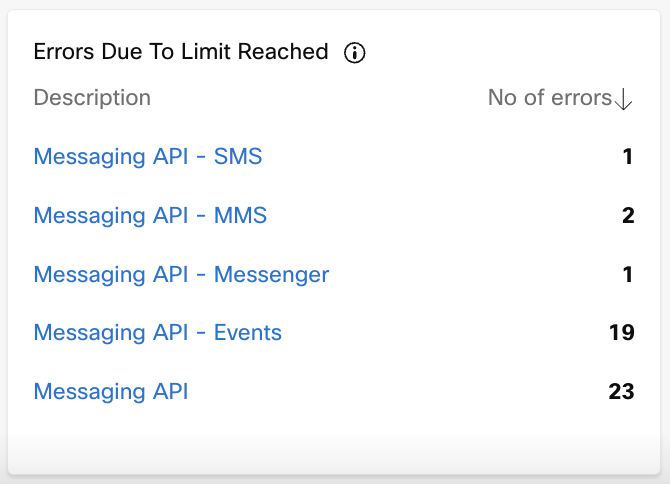
Errors Due to Limit Reached
This section displays the number of failed transactions after the limit is reached, for each message type.
Updated 12 days ago