
Debug Console
View transaction details and troubleshoot issues using a Transaction ID or a Destination ID or a date range
The Debug Console allows you to view transaction details and historical logs for all your API, flow, and rule executions on Webex Connect. This includes details such as event/message status, transaction timestamp, service name, source of the transaction, errors, and more.
Understanding the Debug Console
- The default querying period is 30 days. However, if archive search is enabled and the retention period is set for archive search, then records of up to a maximum range of 60 to 90 days can also be queried at a time in both tabs i.e., Channels and Integrations.
- Decrypting Logs - Logs are visible in the encrypted mode by default. The Decrypt Logs button is enabled for users who have permissions associated with their user account. If permissions are granted, then the Decrypt Logs button is enabled for the user. The Webex Connect platform uses AES and secure key for encrypting personal information.
Note
For Outbound Logs - To, Message Body, and Payload are the encrypted fields.
For Inbound Logs - From, Message, or any personal information are the encrypted fields.
When you click Decrypt Logs, the logs are decrypted using the Master Key associated with your tenant. The Master Key must be auto regenerated on regular intervals, with '1' month being the minimum and '60' months being the maximum. The default interval is 12 months. Reach out to your account manager for configuration-related information. - Refresh - The Refresh button allows you to refresh the query pages if filters are changed or any other changes are made. The Refresh button is enabled when you search for any transaction logs.

Debug Console
| S.No | Element | Description |
|---|---|---|
| 1 | Channels or Integrations tab (Mandatory for performing a query) | This represents the primary option. You must specify the type of logs you are searching for. The Channels tab shows the channel transaction logs and the integration logs shown in the Integrations tab assist in reviewing logs related to integrations, such as Prebuilt Integrations. |
| 2 | Select Time Range (Mandatory for performing a query) | Select the time range for which you want to query the logs. |
| 3 | Channel Selection (Optional for performing a query) | Choose a channel for which you want to query the log. It is a single selection. Not selecting any channel will query all the transaction logs for all channels for the selected time range. |
| 4 | Channel Identifier (Optional for performing a query) | Enter the channel Identifier for which you want to perform the query. Example – For SMS channel the channel identifier is MSISDN, for Email channel it is emailID. Popular use case - querying with channel identifier allows you to fetch all the transaction logs for a customer. Example – Assume a user’s email is [email protected]. Querying with Email as channel and [email protected] as the channel identifier will fetch all the transaction logs in the selected time range for the user [email protected]. |
| 5 | Select Service (Optional for performing a query) | This option allows you to fetch transaction logs that are executed within a specific Service or using the service key associated with that Service. |
| 6 | Source (Optional for performing a query) | Choose either All or any combination of Flow, Messaging API, and Rule. This option enables you to filter the query based on the specific part of the platform where the transaction occurred. For instance, if a message was sent using a Send node in the Flows, selecting Flows as the source will retrieve transactions specifically performed through flows. On the other hand, if Messaging API and Rule are selected as sources, the query will fetch a list of transactions executed using both the Messaging API and Rule. |
| 7 | Search by Transaction ID (Optional for performing a query) | Perform the query using a Transaction ID i.e., the transaction identifier that the Webex Connect platform returns as part of the response payload when you invoke the messages API to send a message, or invoke a flow using Custom Event API v1 or Inbound Webhook. |
| 8 | Search | Click Search to perform the query. It is important to note that the search button is enabled only after selecting a Time Range. |
| 9 | Decrypt Logs | Allows users to view the decrypted logs. It is important to note that the user should have ‘Decrypt Access’ to be able to see the decrypted logs. |
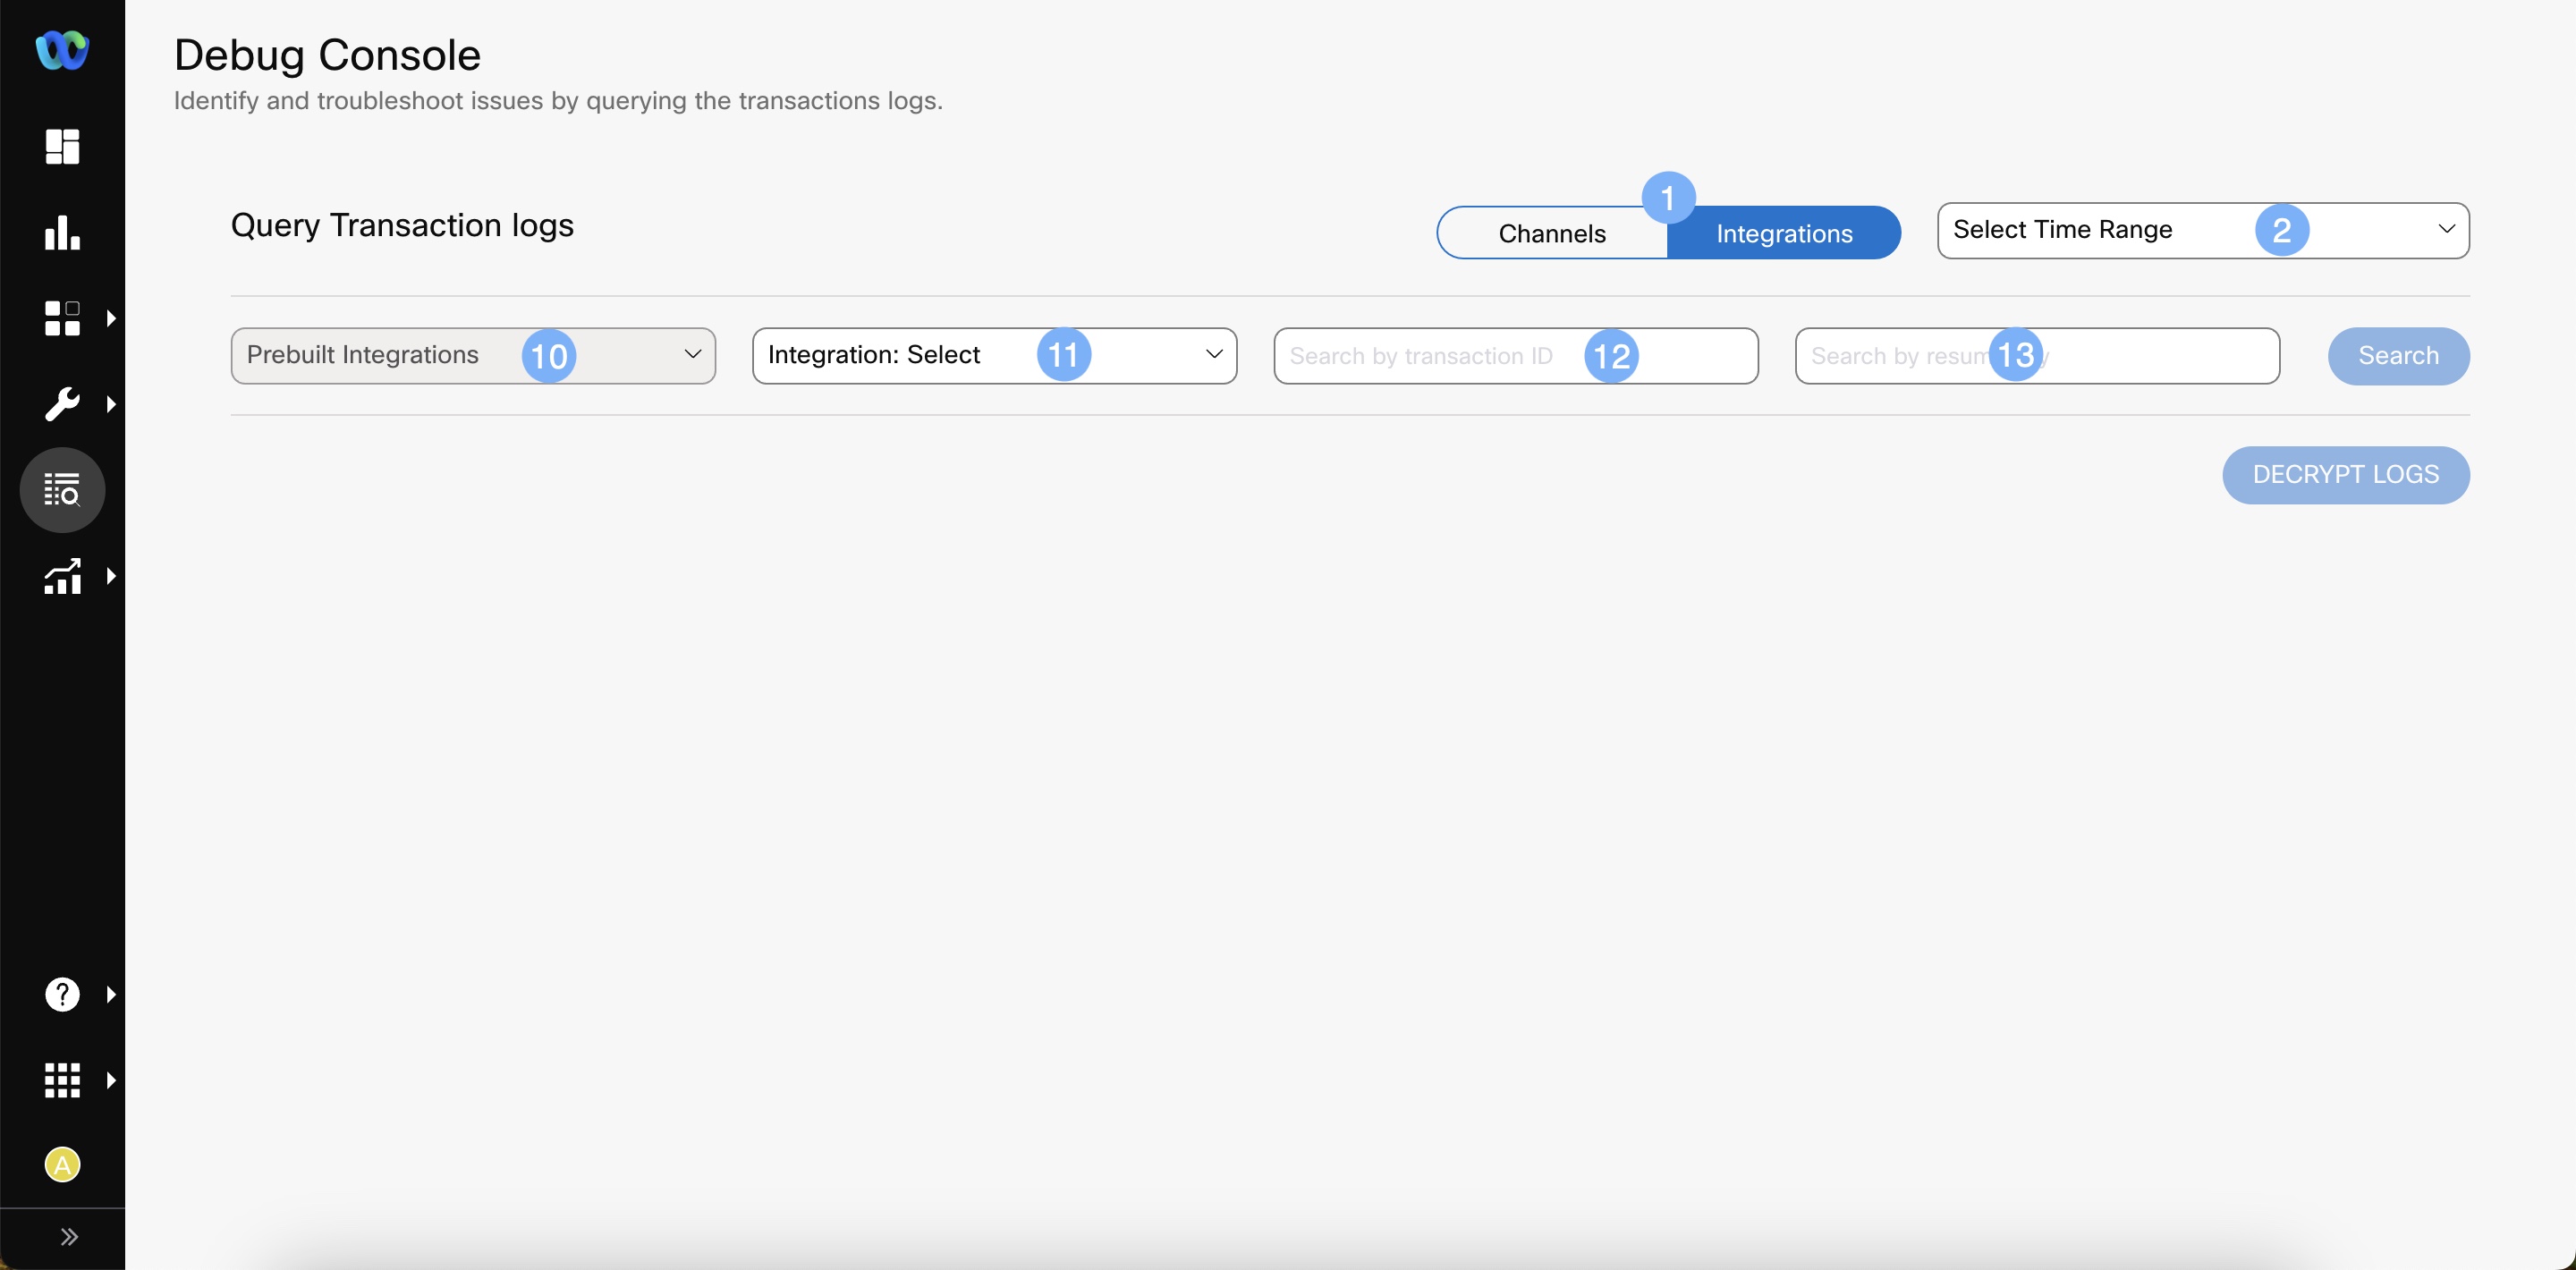
| 10 | Prebuilt Integration | The Prebuilt Integration is selected by default, as the Integrations tab only supports prebuilt integration logs. |
| 11 | Integration (Optional for performing a query) | Select the prebuilt integration for which you wish to query logs. |
| 12 | Transaction ID (Optional for performing a query) | Perform the query using a Transaction ID i.e., the transaction identifier that the Webex Connect platform has captured as part of Prebuilt node execution. |
| 13 | Resume Key (Optional for performing a query) | Search prebuilt integration transaction logs using the resume key used in the events of prebuilt node. |
Note
The logs typically take about two minutes to show in the flow debug console.
Query by Transaction ID
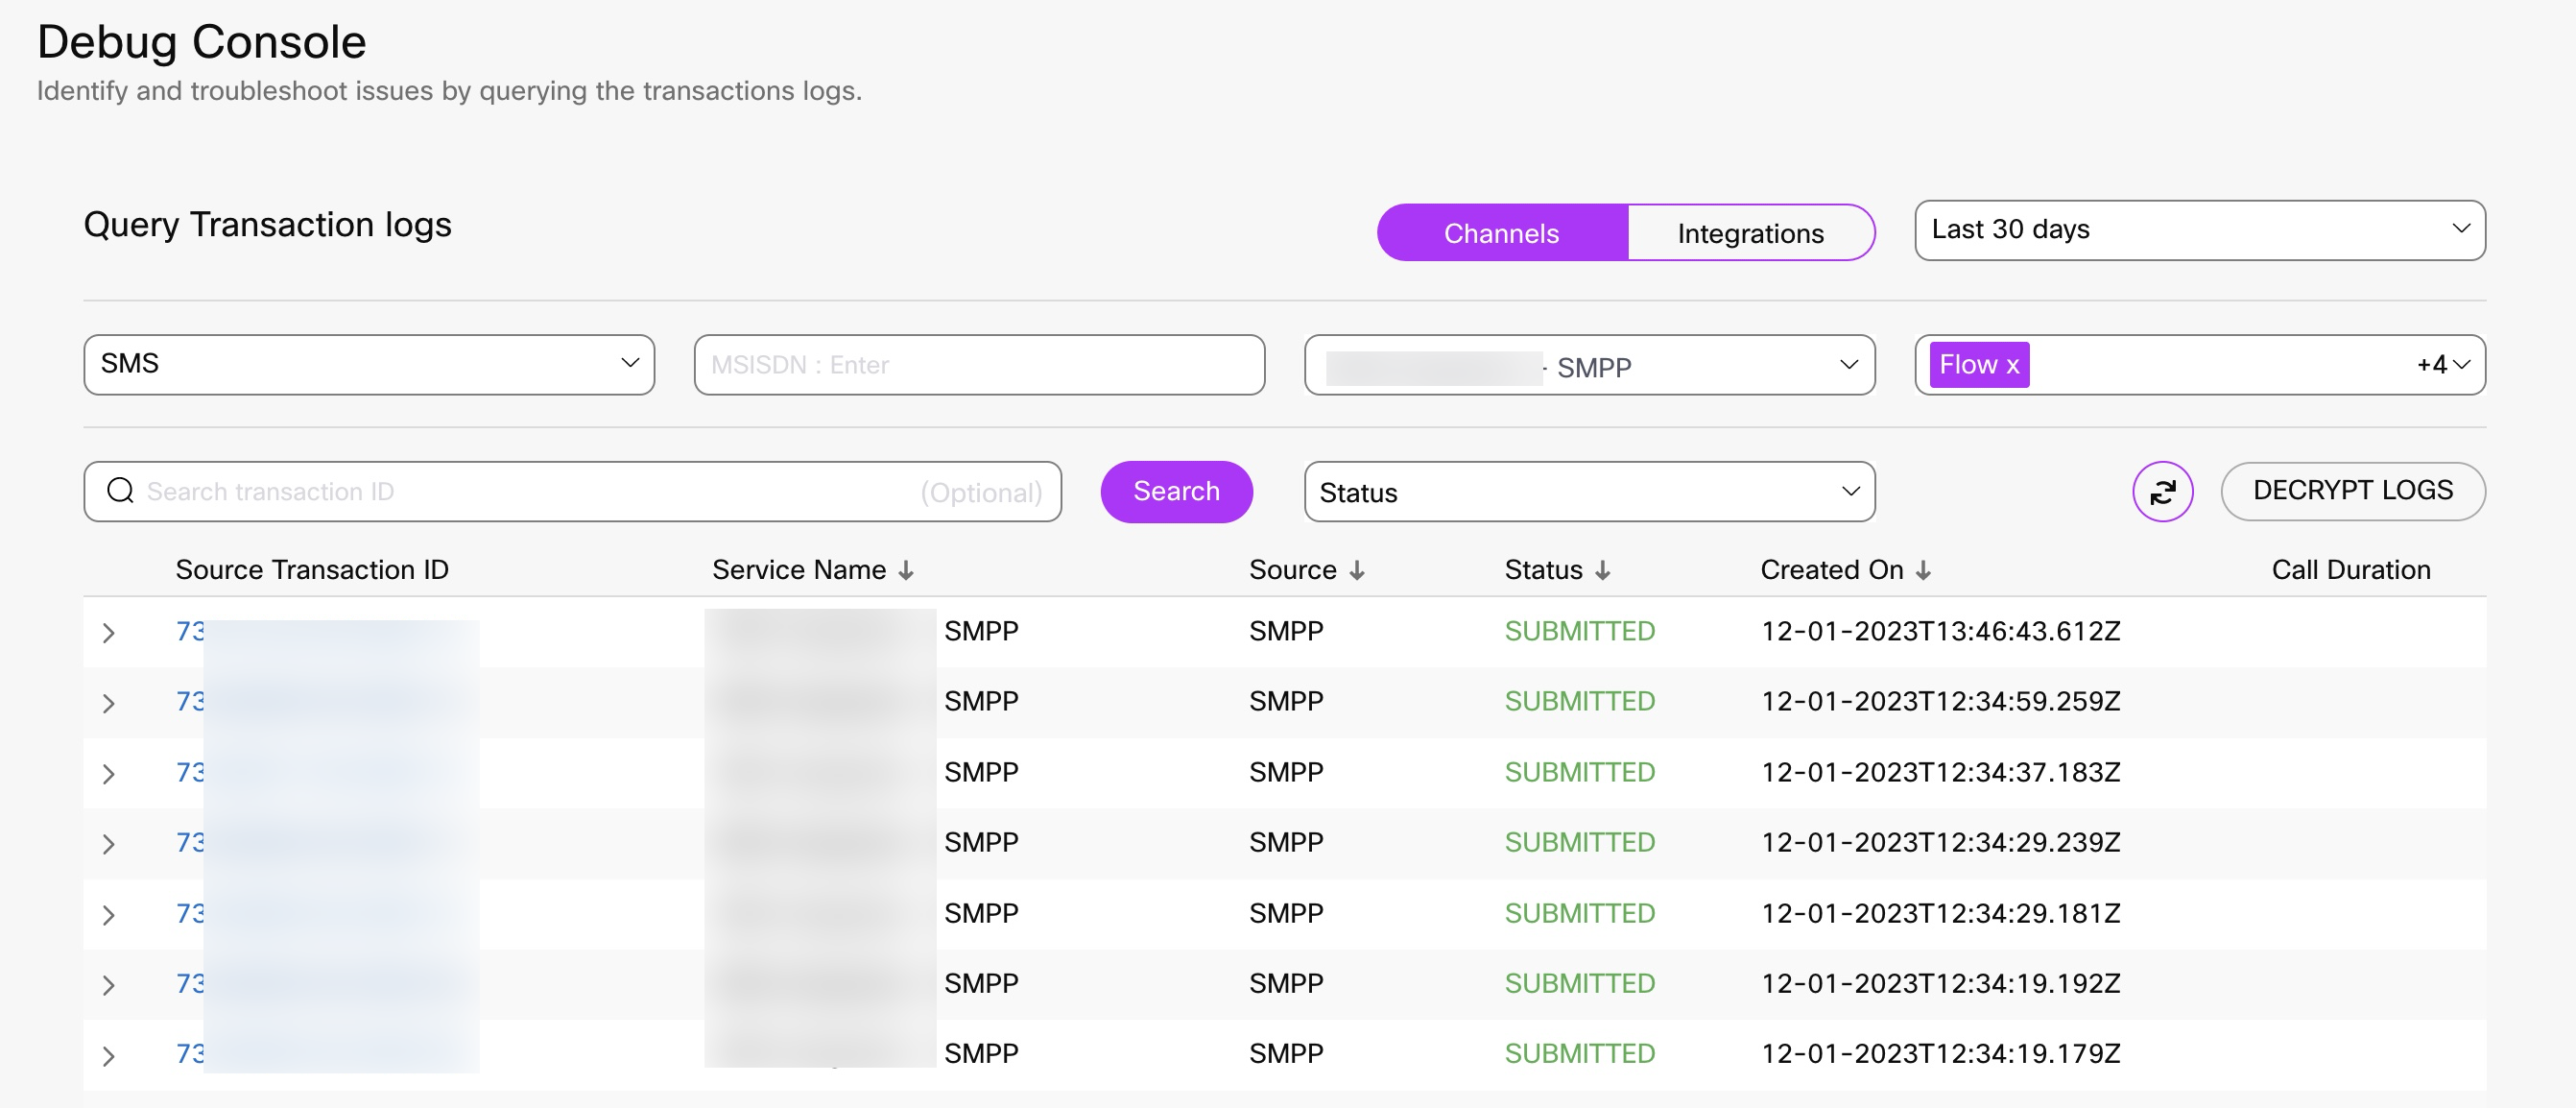
You can search for transaction logs using the channels or transactional ID returned by the Messaging API or the Custom Event API. You can view channel-specific transaction id documentation under Outbound Webhooks. When you search using transaction ID, a table showing recent data associated with that transaction ID appears as shown below.
The table contains the following details:
- Source Transaction ID – the source transaction ID. Click this ID to go to the transaction details page.
- Service Name - the service through which the transaction was initiated.
- Source - the source of the transaction - Messaging API /Flow /Rule. You can see all the transactions are grouped on the source type.
- Status - the status of the transaction - Completed /Received /In Session /Submitted /Inactive/ Clicked/ Unresolved.
- Created On - the date and time on which the transaction was created.
Querying Channels

You can filter using the query parameters listed below after selecting the time range, in any number of combinations with no restrictions.
-
Channel
-
Destination ID
-
Service
-
Source

When you expand the Transaction ID, you can view details such as the message associated with the transaction, its status, and the “created on” timestamp.

Clicking the hyperlink on the transaction ID takes you to the Transaction Details page with additional information.

Clicking on the hyperlinks for Actions and Trace Details displays the flow transaction details and node details.

Clicking the hyperlink in the message ID of a specific transaction of the Debug Console query page takes you to the page enclosing the Message Details, Process Log, and Error & Warnings.
Querying by Channel - Live Chat/ In-App
To query for transaction logs by Channels:
- Select the Channel (Live Chat/ In-App Messaging) from the drop-down list.
- Select the required service from the Service drop-down.
- Select the Time Range.
- Click Search.
All the query transactions are populated.

Transaction ID Flow Details
Click the Transaction ID if you want to get further flow details. Clicking a Transaction ID link will open the transaction details page.

Transaction ID Query
Availability
You can only see the transaction logs for the last 30 days.
Note
If +E.164 format is enabled for your tenant - all the sender and recipient numbers will be displayed in E.164 format.
Search will be supported with or without +E.164 format.
This format displays the number with a "+" followed by the country code and the phone number.
Query by Channel - SMS SMPP
To query for transaction logs by Channels:
- Select the Channel (SMS) from the drop-down list.
- Select the SMPP service from the Service drop-down .
- Select the Time Range.
- Click Search.
All the the query transactions are populated.
Query by Destination ID
You can search for all the sent and received messages to a customer based on customer identity. When a user searches using Destination ID, a table showing recent data associated with that Destination ID appears.
The table contains the following details:
- Source Transaction ID – the source transaction ID. Click this ID to go to the transaction details page
- Service Name - the service through which the transaction was initiated
- Source - the source of the transaction - Messaging API /Flow /Rule. You can see all the transactions are grouped on the source type.
- Status - the status of the transaction - Completed /Received /In Session /Submitted /Inactive/ Clicked.
- Created On - the date and time on which the transaction was created
You can view all the source transactions and messages grouped by Source Transaction ID in a single page view.
List of source transactions ID’s along with message ID’s are grouped under each is shown with filter options:
- Service
- Source
- Status
- Time Period
All the transactions are grouped according to the source type.
Moreover, you can also check node executions of each source transaction associated with the Destination ID by clicking on the respective Source Transaction ID and/or Message ID links that redirects you to the respective details page.
Following are the source types:
- Flow
- Rule
- API
Note: Status at source transaction-level appears as per the type of transaction. Click the drill-down button of the source transaction to expand the details.
Click the Message ID if you want to get further message details. Clicking on a message ID link will open the message details page.

Grouping based on Source
Note:
- Status column in the source transaction row is status of the flow execution but in the message id row it is message status.
- The status filter has both flow transaction status and message status which can be selected using the list items in filter dropdown.
- Sorting by default is by created on (latest record on top).
- All the messages are grouped by source transaction ID, in case of flows you can see the messages grouped by flow transaction.
| Channel | Identity |
|---|---|
| SMS | MSISDN - Phone number in E164 format |
| Voice | MSISDN - Phone number in E164 format |
| MMS | MSISDN - Phone number in E164 format |
| IGSID - Received in the first and subsequent incoming messages from customers on Instagram message | |
| Messenger | PS ID - Received in the first and subsequent incoming messages from customers on Facebook Messenger |
| In-app Messaging | User ID - Can be set by the app developer by calling the SDK methods |
| WA ID - The E164 formatted phone number of the user | |
| Push Notifications | Push ID - Received when a user is registered for a push by the app developer |
| Email ID | |
| Google Business Messages | Conversation ID - Google Business Messages assigns the conversation an ID. Conversation IDs are persistent and unique to the user and the agent. If the same user contacted a different agent, that conversation would have a different conversation ID. The Conversation ID would be valid for 30 days from the date of the last message received from the end user. A new conversation ID is generated when the old ID expires and the user initiates a fresh conversation. |
| Apple Messages for Business | ABC ID - Received in the first and subsequent incoming messages from customers on Apple Messages for Business |
| All Channels | Customer ID - If you create a profile of the customer using the Profile APIs and link the channel profiles to the user profile, you can query by customer ID which displays all messages sent to the user through Webex Connect over the last 30 days |
Availability
Transaction logs are stored for up to 30 days on the platform.
Voice calls
You can query the summary of a call by the destination. This provides a detailed view of how the call progressed. You can also listen to prompts played to the user and recordings.

Query by Destination for Voice Calls
WhatsApp
Using the debug logs, you can see all the transactions and the details of each transaction.
- Select WhatsApp as Channel.
- Enter/select all the other search criteria.
- Click Search.

Here you can view all the transaction logs along with the status of the messages.- Read, Submitted, in-session, Delivered, Failed, Invoked, Unresolved, and so on. You can filter the logs by status.
Please note that Call Duration is showing up as Zero currently in Debug Console results when you view the details for a large number of calls at once due to a bug that's planned to be fixed in a future release. However, the duration is available when looking at an individual transaction.
Drill-down the log to view more details like message ID, direction (inbound or outbound), created date, body, source, from, to, message priority, and payload

Historical Logs
It allows you to search for all incoming and outgoing messages on a channel over a specific time period.

Historical Logs for SMS
Querying Integrations

Before the time range is selected, only the filter parameters in the above screen capture are visible.

After you select the time range and click the Search button, some additional filter criteria are displayed as shown in the above screen capture.
You can select or add the search parameters listed below in after selecting the time range, in any number of combinations with no restrictions.
*Prebuilt Integrations - Cannot be changed
*Integration
*Transaction ID
*Resume Key
*Node
*Method
*Service
*Source
*Status

Clicking the expand button next to a flow transaction displays the request details by the connect system to the integrating system and the response received from the integrating system.

Clicking on the hyperlink of the flow transaction takes you to the flow transaction details page. Clicking o the hyperlinks for Actions and Trace Details displays related information on the screen.
Types of Flow Transactions
*There are three types of flow transactions. They are indicated in the Type column of the main query page.
*Node Outbound: Refers to API calls sent by the Webex Connect system to the integrating system.
*Inbound Event: Refers to API calls sent by the integrating system to the Webex Connect system.
*Async Event: Refers to API calls sent to the integrating system for which response is received after a certain time lag.
Unresolved Status
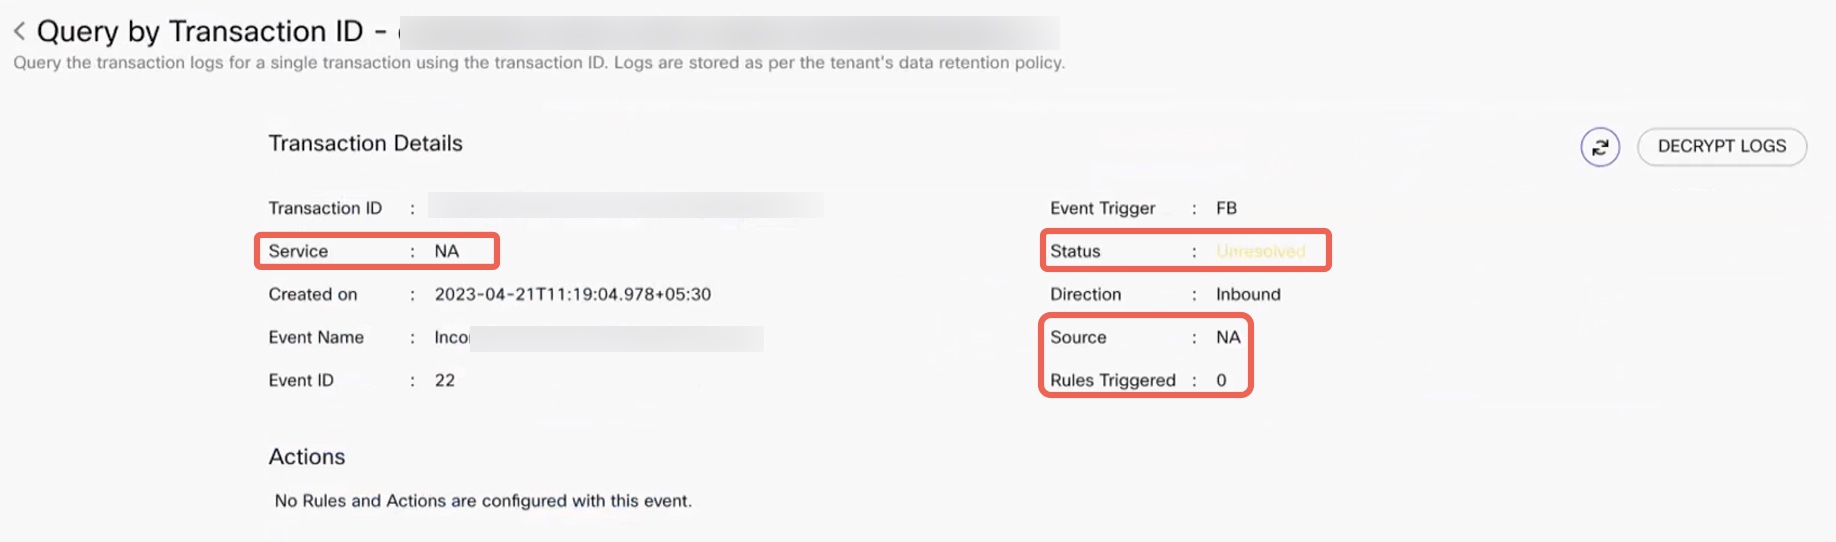
When a message or event received from an end customer is not resolved to any flow and/or rule (i.e., no trigger condition matched with the incoming message or event), such messages and events for all channels are categorised as 'Unresolved' in the Debug Console. The same happens for Inbound Webhooks and Event API triggers that are not mapped with any Flow and/or Rule.
To see the list of the unresolved messages and events:
- Go to Debug Console.
- Select the Channel for which you want to see the unresolved messages and events.
- Select the Time Range.
- Select any other search criteria you want.
- Click Search.
- From the search results, filter the Status column to display Unresolved.
- Click any transaction to see the details.
You can see that the status is Unresolved, Source and Service are NA (Not Applicable), and the Rules Triggered is 0, because the transaction is not resolved.
Updated 4 months ago