
Flow Debug
View detailed execution logs, find, and fix problems in individual flow runs
Flow Debug provides a step-wise execution trace for your recent flow executions. You can find and fix problems in your flows using Flow Debug. This capability is typically meant to be used for troubleshooting purposes while configuring and iterating flows. We recommend you to use Debug Console for viewing old transaction logs.
You can launch the flow debug panel using the Flow Debug icon at the right navigation panel of your flow canvas. The Flow Debug panel opens in a split view at the bottom of your flow and displays a list of 10 most recent flow runs. Typically logs take about two minutes to show in the flow debug section. You may not see the logs for a recently initiated transaction immediately.
- Click the transaction ID to drill down to the details of each flow run (transaction)
- Filter the flow executions using the transaction ID
- Filter the logs based on selected date range and time (Logs are available for the latest 30 days).

Debug - Canvas split view
The information captured within logs is segregated into three levels based on the sensitivity of the data and the level of detail:
- Level 1: Summary Logs
- Level 2: Sequence Summary
- Level 3: Node Execution Details.
You can now see the timezone along with the timestamp in the transaction logs.

Transaction Sequence Summary
This view lists the complete sequence of nodes executed for the selected transaction. It also lists the time taken to execute each step and the outcome of each step. Step here refers to the runtime execution of a particular node. This view allows you to verify the business logic within the flow without going into technical details.
Since navigating to a specific node in a large flow can be cumbersome, flow debug automatically shifts the canvas to the respective node when you click on a node name under the 'Node' column.
Encryption
Summary logs do not contain personally identifiable information (PII) and are therefore not encrypted. However, the details of node execution may contain PII, in which case such information is encrypted. Only users who are authorized by the client admin can decrypt these detailed logs to view them in plain text.
Node Execution Details
The node execution details are available only to users authorized by the tenant onwer. This view, by default, shows PII in encrypted form. However, basic information such as the outcome of the node and the execution parameters like start time is available to all users in plain text.
Note
For all the flows created after the v6.3.0 release, there is a limit of 1000 for the number of node executions within a single flow. If the number of node executions exceeds 1000, the node execution fails with an error “System limit reached.”
Capturing Node Execution Details during Initial Set-up.
You must enable the Descriptive Logs option under flow settings to capture node execution details. Please note that this feature is suggested to be used only during initial flow set-up and troubleshooting. Enabling this feature in production mode can impact your tenant performance.

Node Level Execution Details
In the case of voice flows, you can see the various voice nodes within the flow and the sequence in which the nodes are executed. If the flow contains the voice node group, then you can drill down to the individual nodes in the group.
When a voice flow has recordings, you can click Recordings to play the recordings directly in the debug console. You can also see the call duration and audio prompts configured and played to the caller during an ongoing call.
Voice Flows
Transaction Logs
- Decrypts Logs: the additional description of the action performed by the node under the transaction in encrypted mode.
- Time Stamp: the time at which the flow execution started
- Transaction ID: the ID number created for the transaction
- Invoked By: the trigger that invoked the flow
- Time Taken: the time taken to execute the entire flow
- Last Node: the last node that was in use when the flow ended
- NodeID : ID of the current node in the flow
- Outcome: the node event of each node
- Details: details of the node execution.
As mentioned above, flow debug allows you to analyse step wise execution of your recent flow executions and is mainly best suited for understanding how your flow is progressing and where there are issues, if any, during initial flow configuration and prototyping phases. If you want to analyse a transaction within last 30 days period, or want to look at the past 30 days of message exchanges for a given customer or channel, you can use Debug Console feature.
Transaction Channels
The following parameters are displayed in the Debug flow of the Start Node:
| Channel | Event in Start node | Parameters to be shown in transaction logs |
|---|---|---|
| SMS | Mobile originated -MO | Timestamp Sender Number Service Number Message |
| SMS | On Link click | Timestamp Sender Number |
| Voice | Inbound call | Service Number Timestamp MSISDN |
| Voice | Missed call | Service Number Timestamp MSISDN |
| MMS | Mobile originated -MO | Sender Number |
| Messenger | Incoming Message | AppId PSID Message Attachment URL Timestamp Location URL |
| Messenger | On link click | AppId PSID Tim_estamp |
| Messenger | Postback | AppId PSID Timestamp Post_back Payload |
| Incoming Message | AppId WaId Timestamp Message Image URL Location URL Voice URL Audio URL Video URL Sticker URL | |
| Postback | AppId WaId Timestamp Button Payload | |
| List Message | AppId WaId Timestamp List Description Row Title Row Identifier | |
| WhatsApp Reply button Message | AppId WaId Timestamp Reply Button Title Reply Button Identifier | |
| In-App / Live Chat | Custom event | UserId PushId Timestamp AppId |
| In-App / Live Chat | Geo enter | UserId PushId Timestamp AppId GeofenceId |
| In-App / Live Chat | Geo Leave | UserId PushId Timestamp AppId GeofenceId |
| In-App / Live Chat | Incoming Message | Timestamp UserId PushId Message Attachments DeviceId Version Threadid |
| In-App / Live Chat | On thread close | Threadid AppId UserId |
| In-App / Live Chat | On postback | Timestamp UserId PushId Message Attachments DeviceId Version ThreadId Button Payload |
| Incoming Message | Message Emailid AppId To Address Attachments Receipts Timestamp | |
| Subscribe | Emailid AppId Attachments Timestamp | |
| unsubscribe | EmailId AppId Attachments Timestamp | |
| RCS | Incoming Message | Text Timestamp AppId Number |
| RCS | Message Incoming attachment | Text Timestamp AppId Number File URL |
| RCS | Location response | Text Timestamp AppId Number |
| RCS | Postback | Text Timestamp AppId Number Postback Data |
| Apple Messages for Business | Conversation closed | ABCUserId AppId |
| Apple Messages for Business | Interactive Message authentication | AppId AuthToken AuthStatus |
| Apple Messages for Business | Interactive Message list picker | ABCUserId AppId Timestamp Date Picker Time Slot Date Picker Duration Time Slot Identifier Time Slot Start Time List Picker Items List Picker Other Items |
| Apple Messages for Business | Interactive Message payment | ABCUserId AppId Timestamp Payment Status |
| Apple Messages for Business | Incoming Message | ABCUserId AppId Timestamp Message Attachment URL |
| Apple Messages for Business | Interactive Message quick reply | ABCUserId AppId Timestamp Selected Identifier Selected Index |
| Apple Messages for Business | Interactive Message form response | ABCUserId AppId Timestamp Selections Selections Count |
| Apple Messages for Business | Typing indicator | ABCUserId AppIdAppId Type |
| Apple Messages for Business | Interactive Message new authentication | AppId AuthToken AuthStatus |
| Apple Messages for Business | Interactive Message iMessage extension | AppId URL |
| Custom event | Payload Timestamp | |
| Google Business Messages | Incoming Message | AppId ConversationId AgentId Send Time MessageId Text |
| Google Business Messages | User Status | AppId ConversationId AgentId Send Time IsTyping Requested Live Agent |
| Google Business Messages | Survey Response | AppId ConversationId AgentId Send Time SurveyId Question Response Text Question Response Postback Data QuestionIndex |
| Google Business Messages | Suggestion Response | AppId ConversationId AgentId Send Time MessageId Postback Data Text Suggestion Type |
| Incoming Message | MessageId Igsid Igid Timestamp UserId AppId Message Type Attachment Type Attachment Url Story Reply Url Replied MessageId | |
| Message Deleted | MessageId Igsid Igid Timestamp UserId AppId IsDeleted | |
| Postback | MessageId Igsid Igid Timestamp UserId AppId Payload Title Quick Reply Payload |
Inbound events
The following parameters are displayed in the Debug flow of the Receive Node:
| Channel | Events in Receive node | Parameters to be shown in transaction logs |
|---|---|---|
| SMS · | Sender Number Service Number Message Attachment Timestamp | |
| Voice | MSISDN Service Number Message Timestamp | |
| Messenger | Incoming Message | PSID AppId Message Attachments Timestamp |
| Messenger | Postback | PSID AppId Payload Timestamp |
| Incoming Message | AppId WaId Timestamp Message Image URL Location URL Voice URL Audio URL Video URLSticker URL | |
| Postback | AppId WaId Timestamp Button Payload | |
| List Message | AppId WaId Timestamp List Description Row Title Row Identifier | |
| Reply button Message | AppId WaId Timestamp Reply Button Title Reply Button Identifier | |
| Custom event | Payload | |
| In-App / Live Chat | Incoming Message | Timestamp UserId PushId Message Attachments DeviceId Version ThreadId |
| In-App / Live Chat | Form response | Timestamp UserId PushId Form Response Attachments DeviceIdVersion ThreadId |
| In-App / Live Chat | Postback | Timestamp UserId PushId Message Attachments DeviceId Version ThreadId Button Payload |
| Apple Messages for Business | Interactive Message Time picker | ABCUserId AppId Timestamp Message Attachment URL Date Picker Timeslot Date Picker Duration Time Slot Identifier Time Slot Start Time |
| Apple Messages for Business | Interactive Message authentication | AuthToken AuthStatus |
| Apple Messages for Business | Interactive Message list picker | ABCUserId AppId Timestamp List Picker Items List Picker Other Items |
| Apple Messages for Business | Interactive Message payment | ABCUserId AppId Timestamp Payment Status |
| Apple Messages for Business | Interactive Message form response | ABCUserId AppId Timestamp Selections Selections Count |
| Apple Messages for Business | Conversation closed | ABCUserId AppId |
| Apple Messages for Business | Interactive Message new authentication | AppId AuthToken AuthStatus |
| Apple Messages for Business | Interactive Message quick reply | ABCUserId AppId Timestamp Selected Identifier Selected Index |
| Apple Messages for Business | Typing indicator | ABCUserId AppId Type |
| Apple Messages for Business | Interactive Message iMessage extension | AppId URL |
| Apple Messages for Business | Incoming Message | ABCUserId AppId Timestamp Message Attachment URL |
| RCS | Incoming attachment | Text Timestamp AppId Number |
| RCS | Incoming Message | Text Timestamp AppId Number File URL |
| RCS | Location response | Text Timestamp AppId Number |
| RCS | Postback | Text Timestamp AppId Number Postback Data |
HTTP node logs
For HTTP nodes, the flow transactions logs are:
- Request Timestamp
- Request URL
- Request Data
- Response timestamp
- Response Data
Custom node logs
For Custom nodes, the flow transactions logs are:
- Request timestamp
- Request URL
- Request Data
- Response timestamp
- Response Data
Transaction details for Custom event/Webhook is available for a maximum of 7 days.
Prebuilt Transaction Details - Outbound and Async events
For Prebuilt nodes, the flow transactions logs are:
- Resume key
- Request timestamp
- Request URL
- Request Data
- Response timestamp
- Response Data
Variables Created or Updated during the Node Execution
Webex Connect logs the list of the variables created or updated in node executions for all flow transactions under the 'Variables created/updated during node execution' section as shown below. The parameters which meet one of the following conditions will be listed in this section:
- A variable is one of the Output variables of the node and it is used in later part of the flow (mentioned as a variable in the configuration of other nodes).
- The value of the variable used in the node execution is updated after it is used in the previous node.
Note
These logs are generated only when Descriptive logs are not enabled.
Note
Variables created as an object in Evaluate node are replaced in the logs with values received from Rhino engine.
Example -
var Array_vechicle = ['Car', ‘Bike’, ‘Ship’];The value captured in the logs for Array_vechicle: org.mozilla.javascript.NativeArray@99582cf denoting the Array_vechicle is a native array in the Evaluate node script.
The screenshot below is an example of the transaction log from the Receive node:
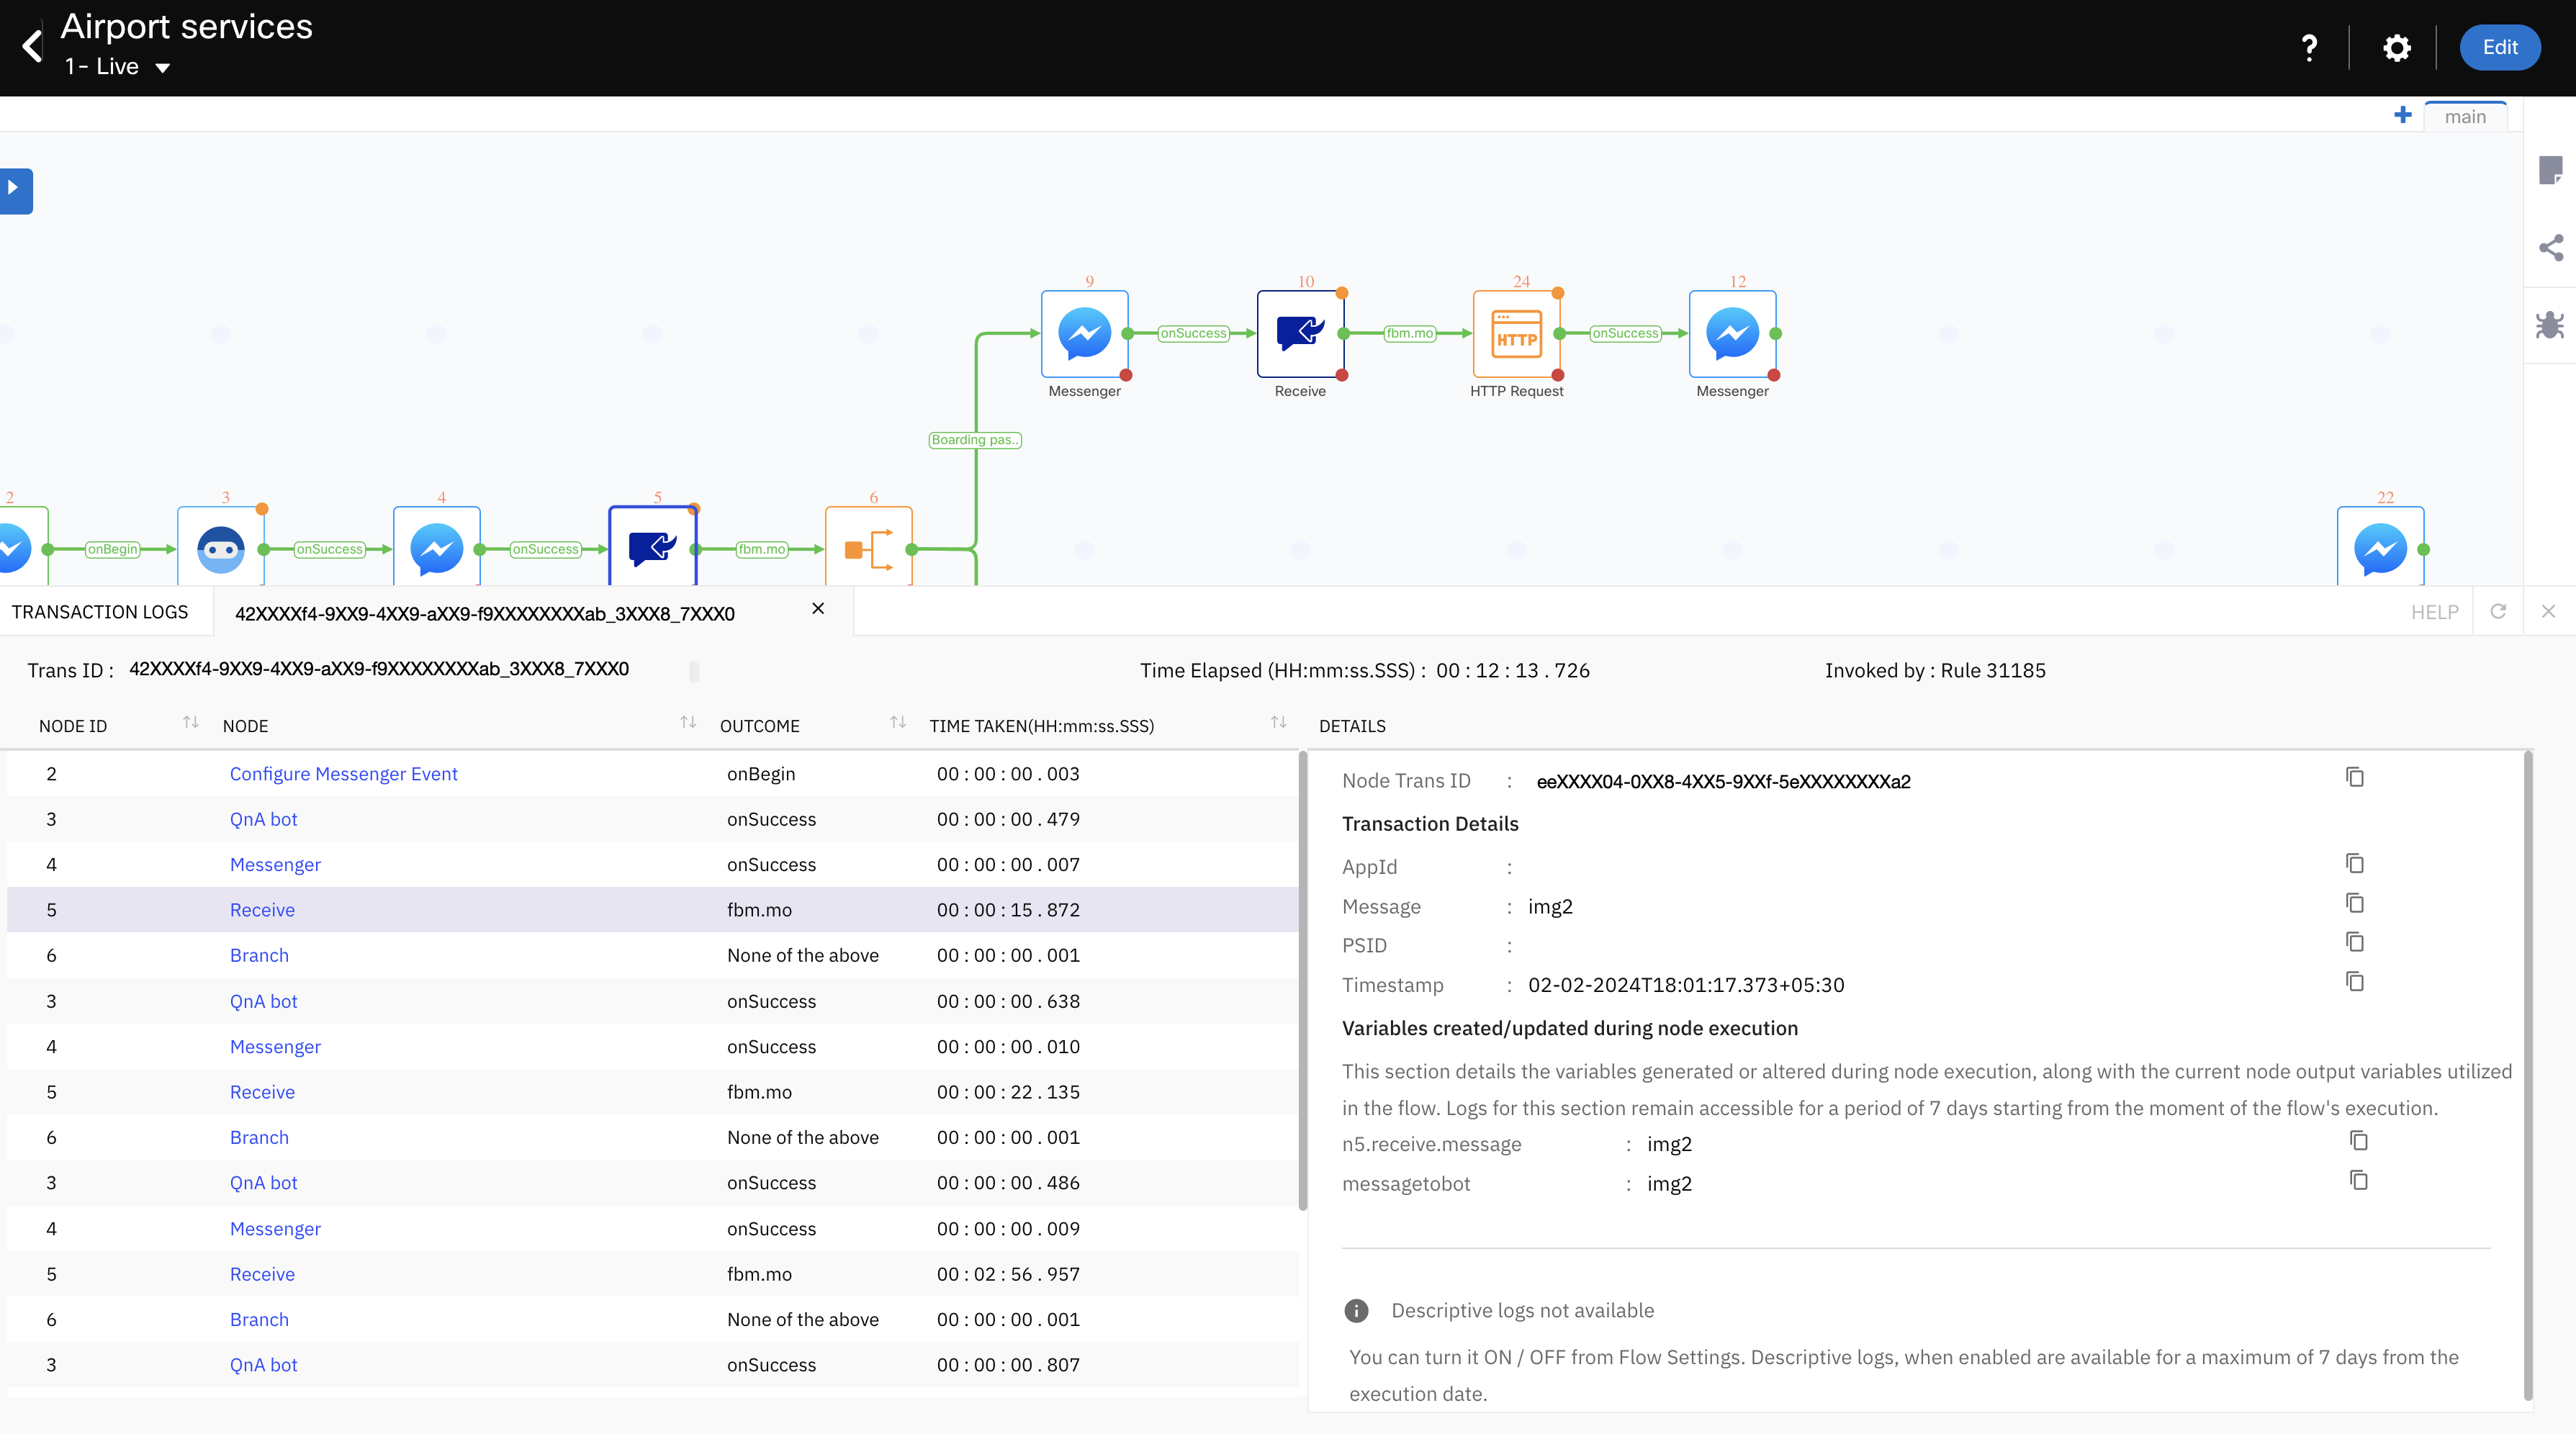
Receive Node - Transaction Log
Updated about 2 months ago