
Reports
View and analyze your messaging, voice, and flow execution traffic
The Reports section helps you view and analyze your messaging and flow traffic across various services. Webex Connect provides reporting at three levels - platform level summary, channel asset level summary, and service level summary.
Here's a brief description of the reports available at each level.
Platform Summary
The platform summary report provides the aggregated count of the total number of messages sent and received across various channels within the specified time period.
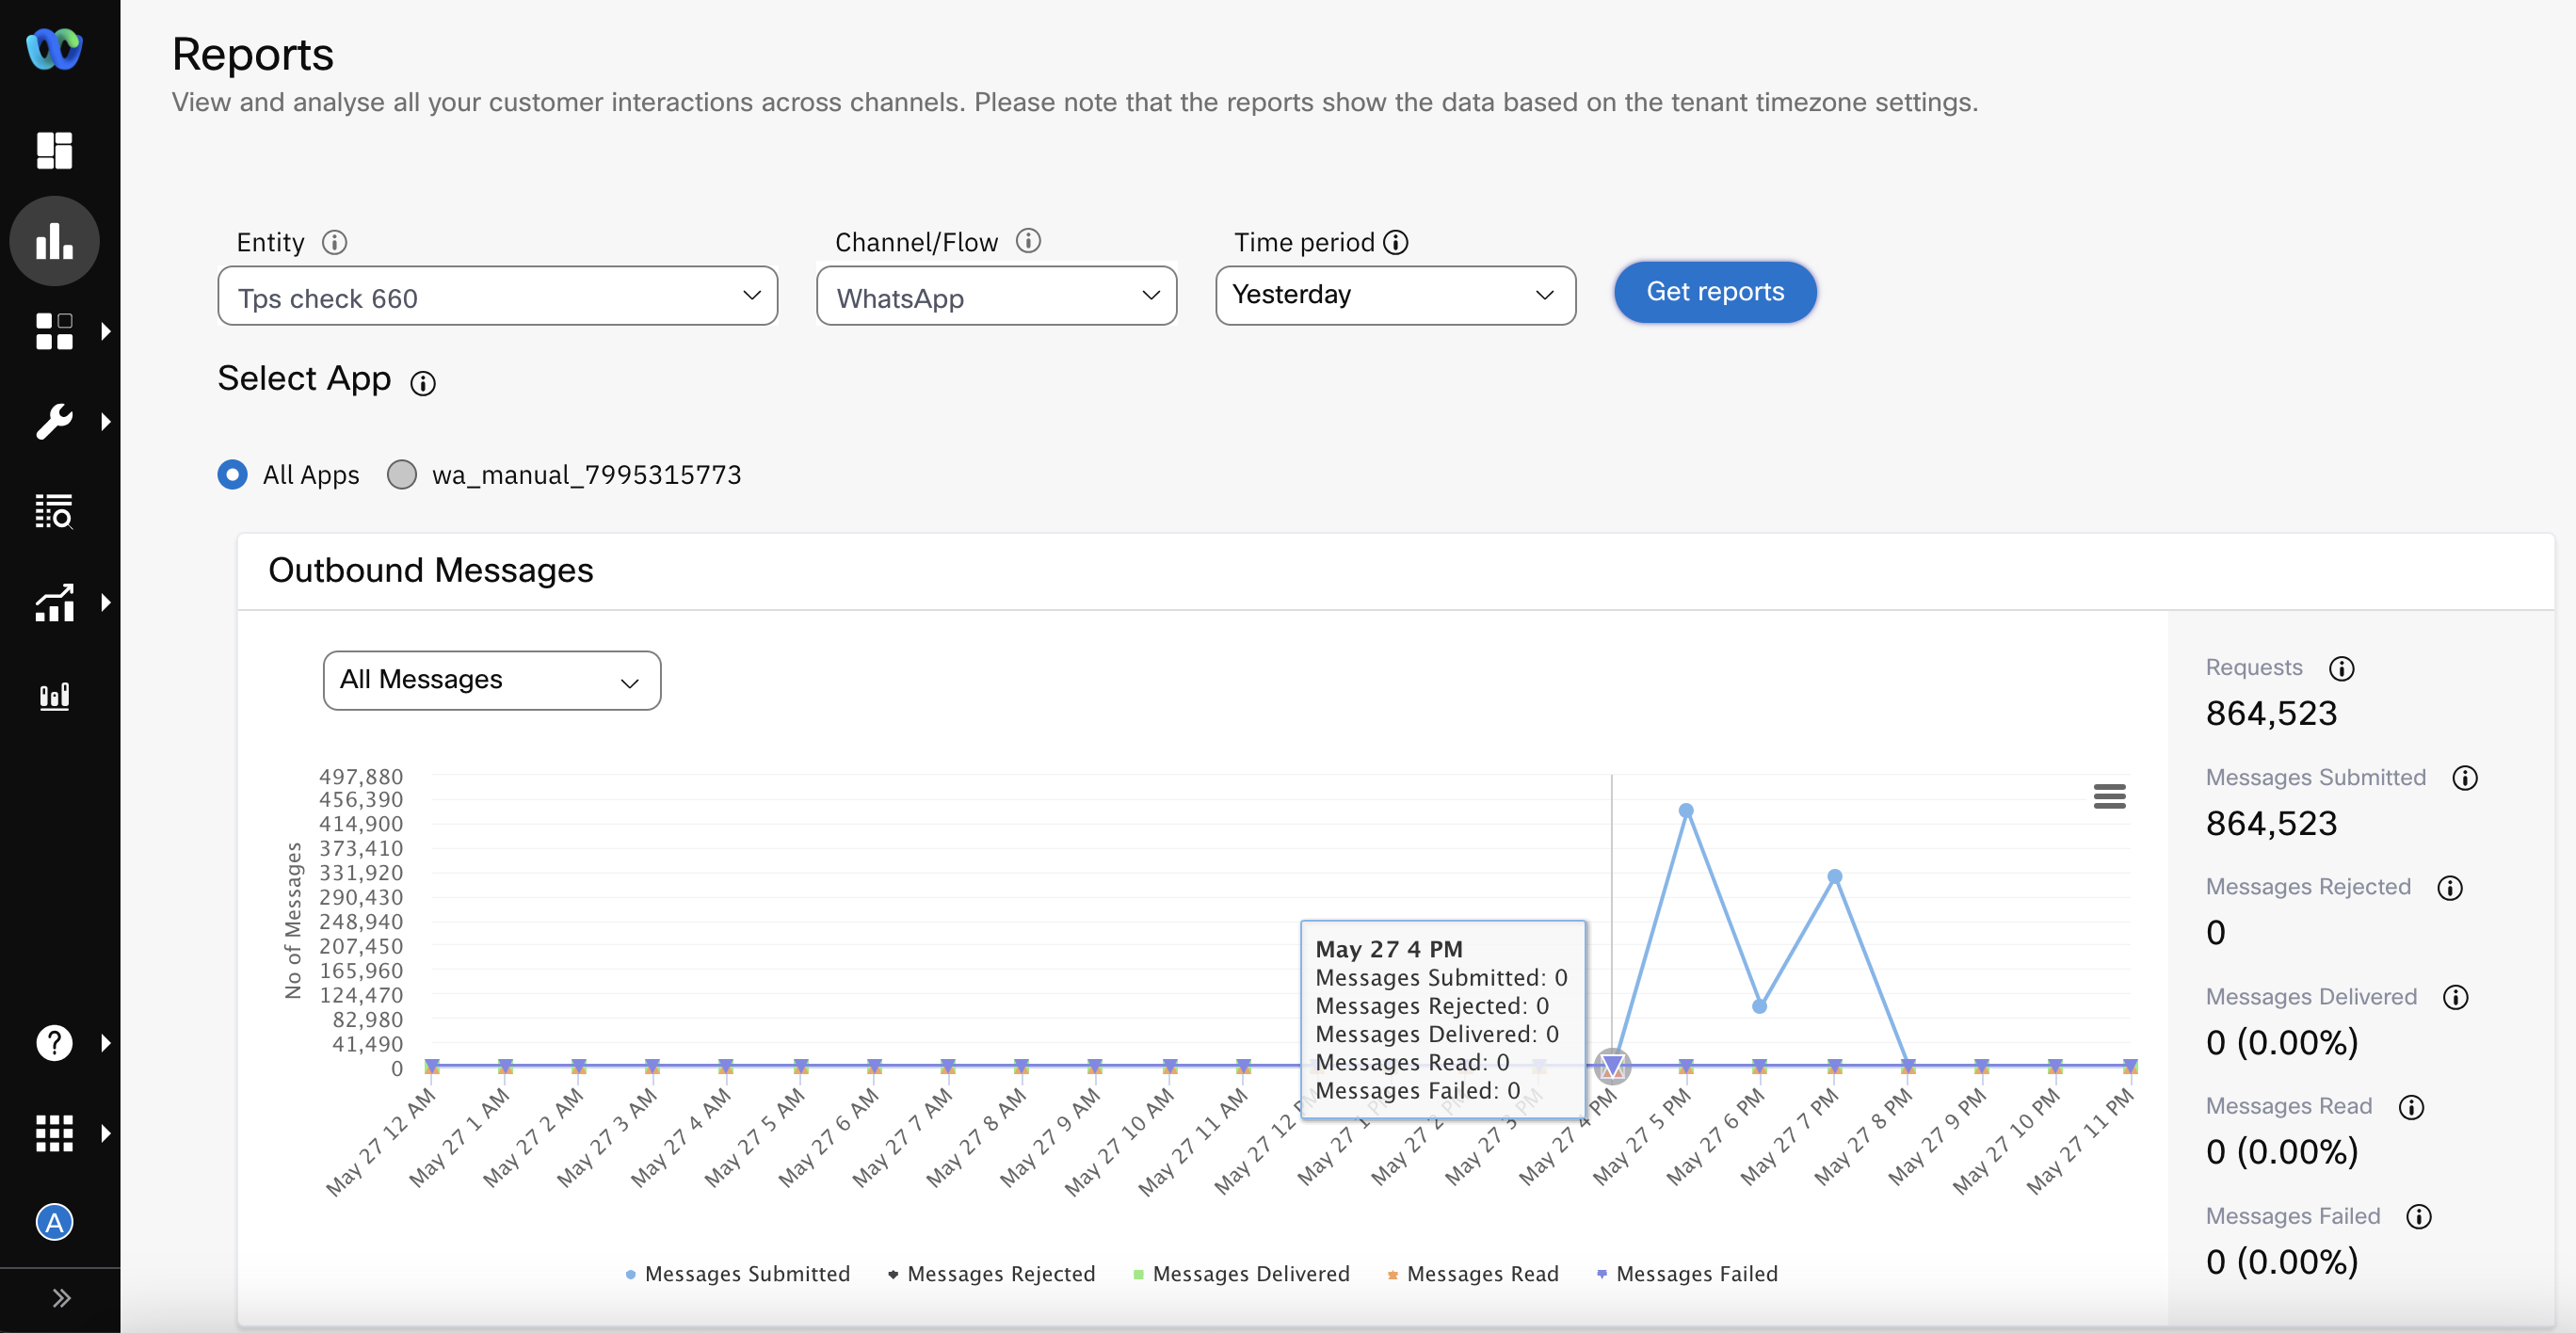
Select Platform > Summary option under the Entity dropdown and mention the time period as shown below.
The apps at channel level are categorized in the Entity dropdown.
Timezone Settings
Please note that the data shown in the report is based on the tenant timezone settings.

The details of messages sent (i.e., messages submitted and processed for delivery) and messages received across various channels will be available as shown below. You can simply hover over the line graph to get the details for any specific day within the selected time period. The data for each channel is represented by a color as shown in the graph. The channels for which data is displayed are as follows:
- SMS
- Voice
- Live Chat / In-app Messaging
- Messenger
- Apple Messages for Business
- RCS
- MMS
- Push

When you select a single day or partial day (Today/Yesterday/Custom) in the Period filter, the hour-wise data is shown on the graph.
If needed, you can download the reports in PNG, JPEG, PDF, SVG, CSV, and XLS format by clicking the hamburger menu icon towards the top-right side of the chart, as shown below.

Reports for Outbound Emails
Sample report for Email channel usage at a service level.
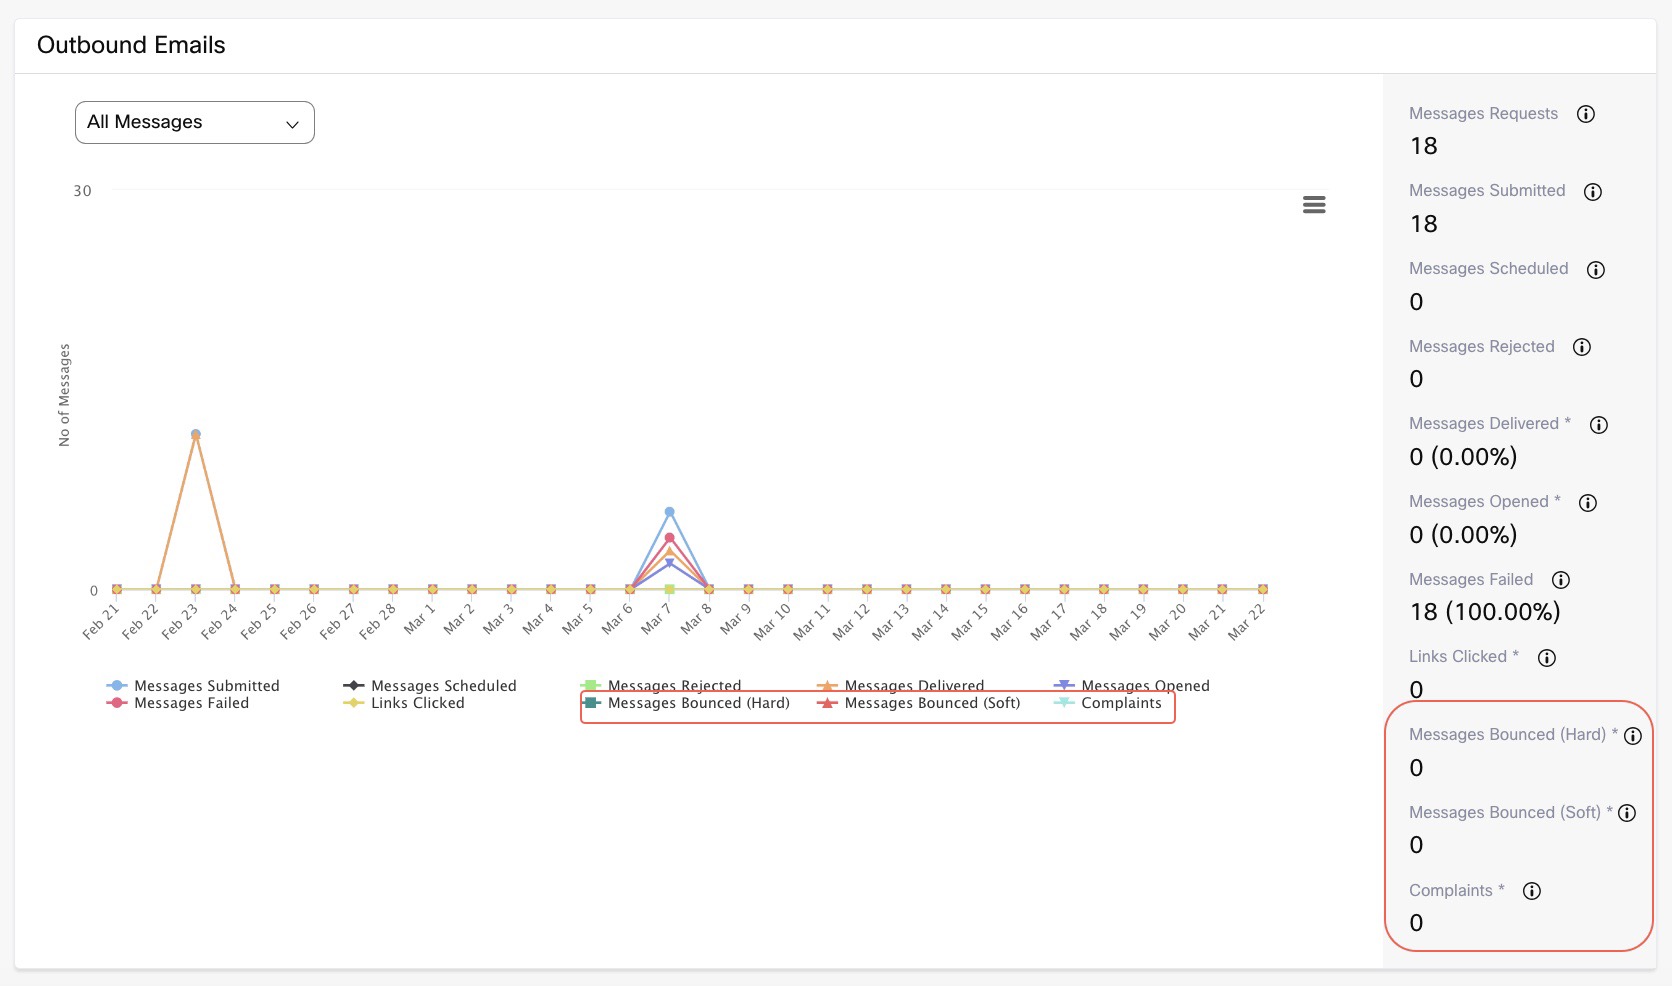
The above screenshot shows details for Email channel usage at a service level with the following data points:
- Total number of requests
- Number of email messages sent
- Number of email messages submitted for processing
- Number of email messages scheduled (email messages waiting to be submitted)
- Number of email messages rejected (email messages rejected by the platform due to various reasons)
- Number and percentage of email messages delivered (email messages with confirmed delivery receipt)
- Number and percentage of email messages failed
- Total links clicked
- Number of email messages hard bounced (not delivered because of invalid email address, etc.)
- Number of email messages soft bounced (not delivered because of insufficient space in the inbox, etc.)
- Number of complaints (phishing, abuse, spam, etc.)
Since it’s not possible to display all the sub-categories at the high-level report, a sub-report for bounced emails and complaints is displayed, called Messages Bounced and Email Complaints.
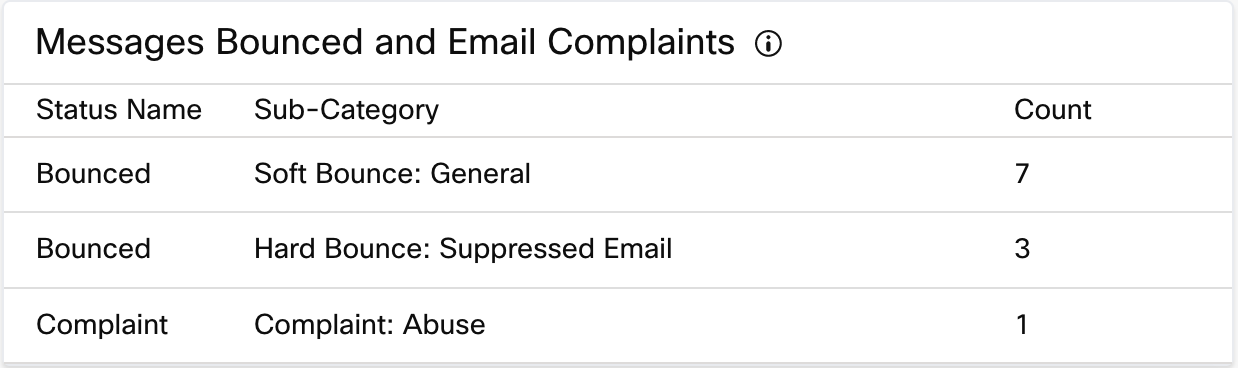
Note
The default retention period for email bounce list is Seven days for email via AWS SES. To change the retention period, reach out to your account manager.
SMPP Reports
The platform summary report provides the aggregated count of the total number of messages sent and received across various channels within the specified time period.
You can generate report by using Service name or by Sender ID (using numbers associated with SMPP service).
Using Service Name
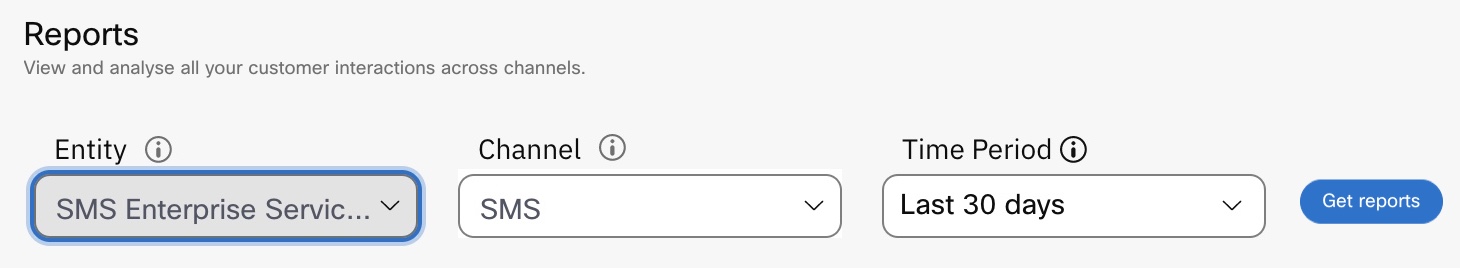
- Select the SMPP service for Entity, SMS for Channel, and the required time period .
- Click Get reports.
The report is displayed with only SMPP as Outbound Messages channel.
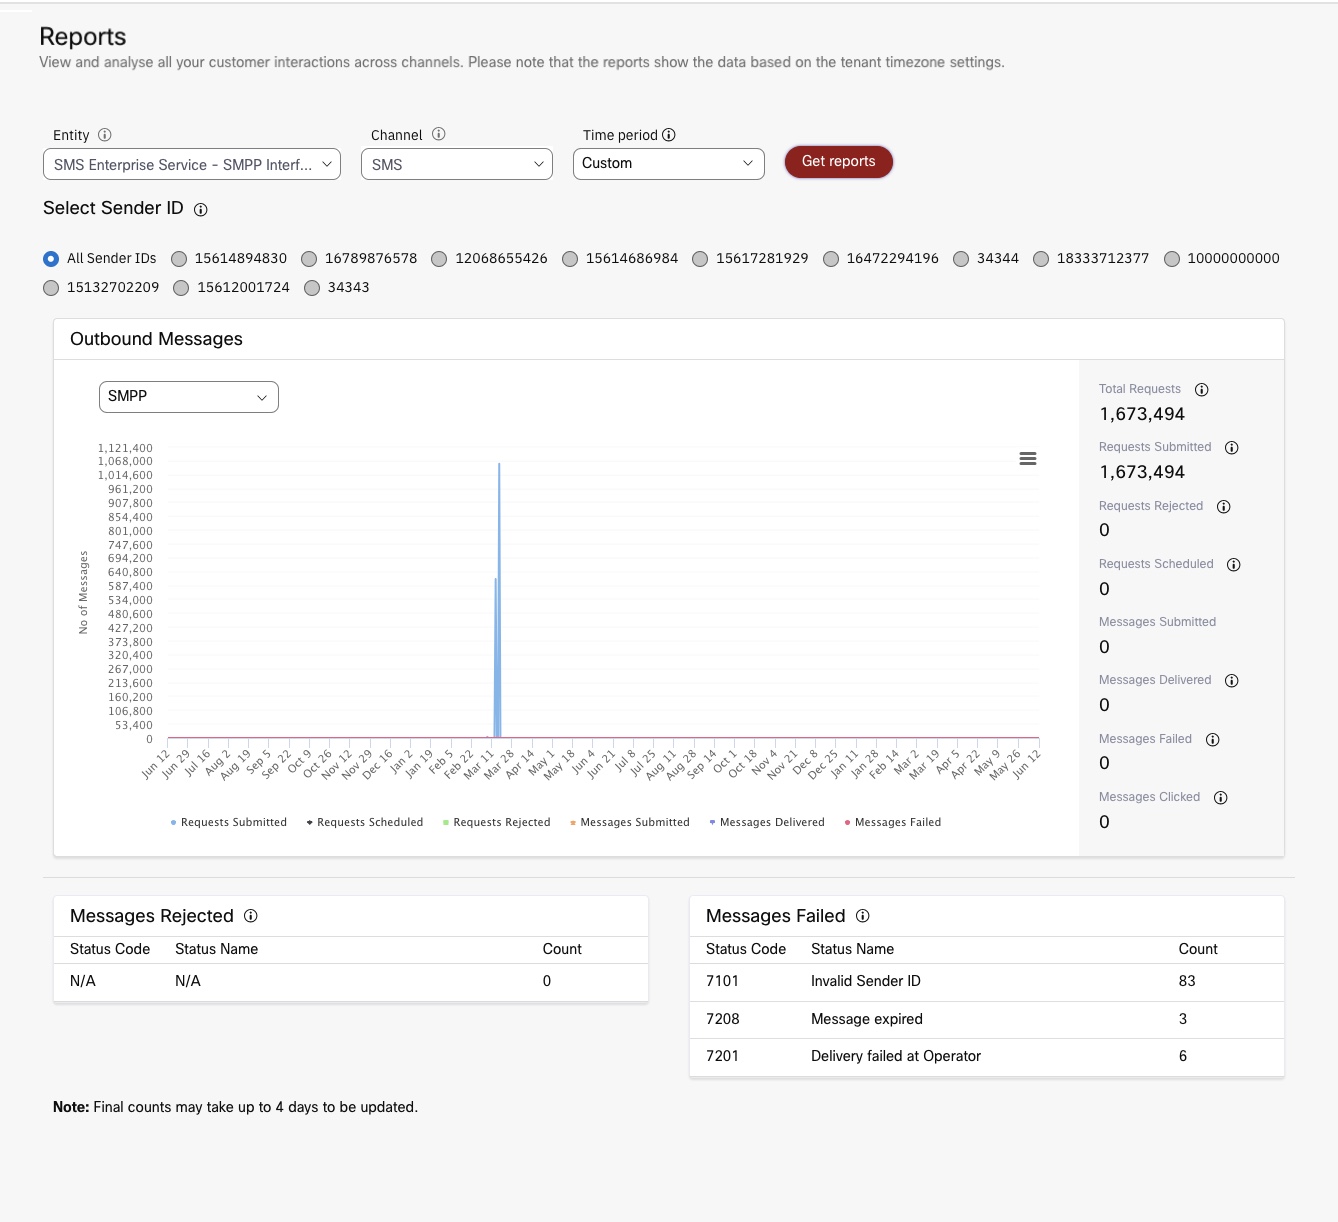
Following is the information that’s displayed as part of the reports:
- Total Requests - Number of requests submitted by the user to the Webex Connect platform.
- Requests Submitted - Number of requests submitted by the Webex Connect platform to the messaging gateways.
- Requests Scheduled - Number of requests waiting to be submitted by the Webex Connect platform to the messaging gateways.
- Requests Rejected - Number of requests rejected by the Webex Connect platform.
- Total Messages Submitted - Total count of messages delivered and messages failed to be delivered to the end user.
- Messages Delivered - Total count of messages delivered to the end user.
- Messages Failed - Total count of messages failed to be delivered to the end user.
- Messages Clicked - Number of messages clicked.
Using Sender ID
- Select the Sender ID for which you want to generate the report.
- Select the required time. Click Get reports.
Note
When you select a Sender ID mapped to SMPP, it will display data related to SMS messages only.
Following is the information that’s displayed as part of the reports:
- Total Messages Submitted (Estimated Segments) - Total count of messages delivered and messages failed to be delivered to the end user.
- Messages Delivered (Actual Segments) - Total count of messages delivered to the end user.
- Messages Failed (Actual Segments) - Total count of messages failed to be delivered to the end user.
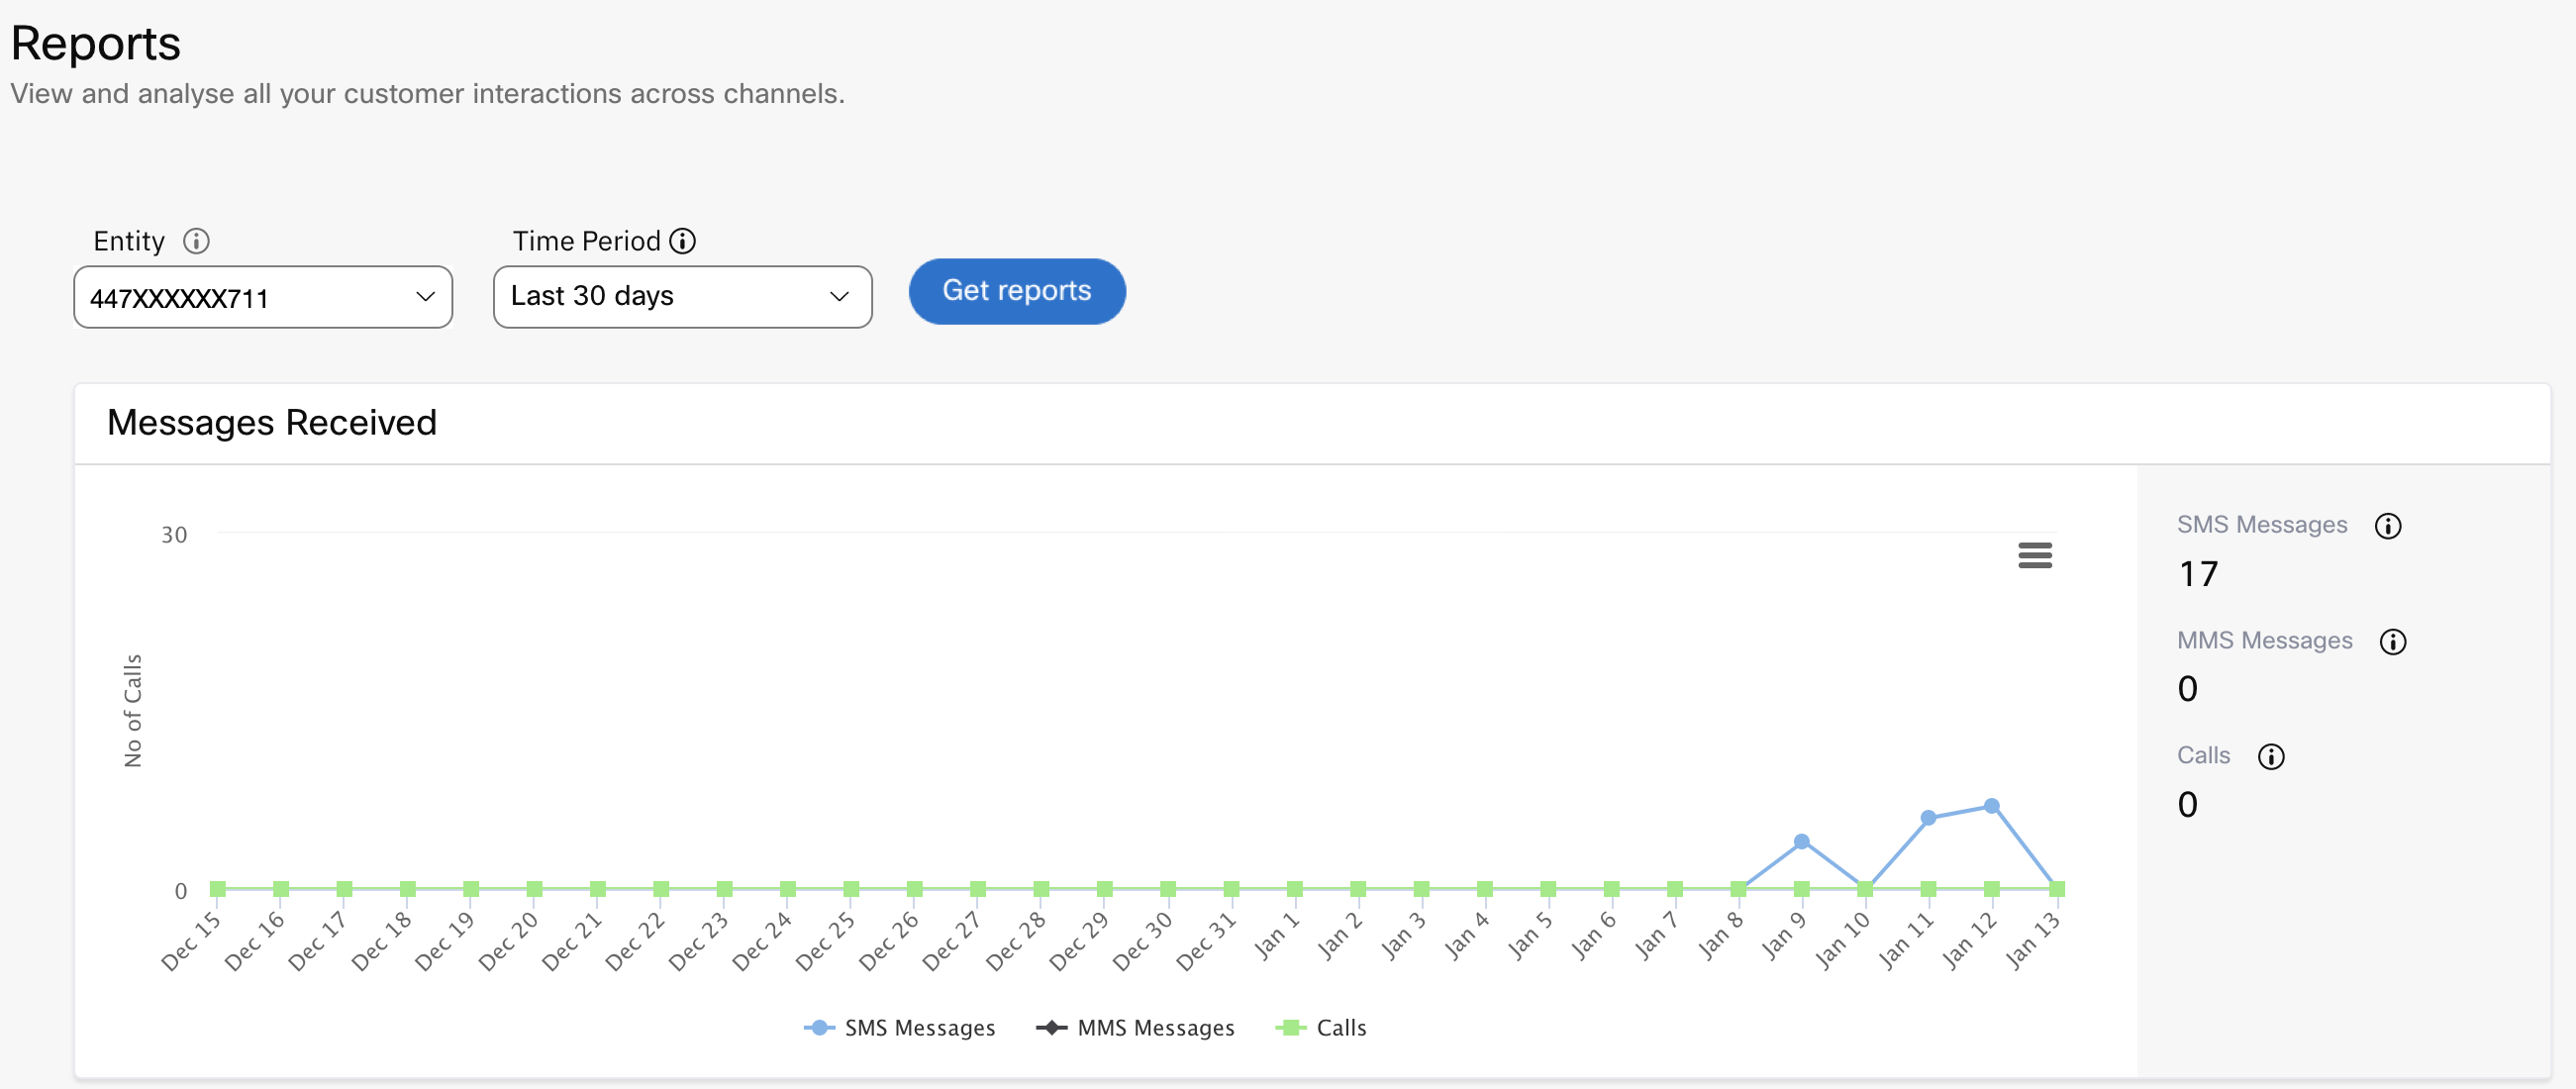
Channel Asset Level Reports
Alternatively, the reports can be viewed at a channel asset level by selecting the channel asset for example a Number (in case of SMS and Voice), or an App (for OTT channels such as Apple Messages for Business and WhatsApp).
Select your desired number or the app name from the Entity dropdown and mention the time period as shown below.

The details of messages received on the selected channel asset (i.e. a number or an app) will be available as shown below. This is the aggregated count of messages received on the select asset across various services within Webex Connect where the selected asset is being used. Hover over the line graph to get the details of the number of messages received on any given day within the selected time period.

Service Level Reports
While the high-level stats of messaging, flow execution, and API invocation details for each service are visible as soon as you enter the service-specific dashboard (sample below), more granular information about channel usage and flow executions are present within the Reports section.
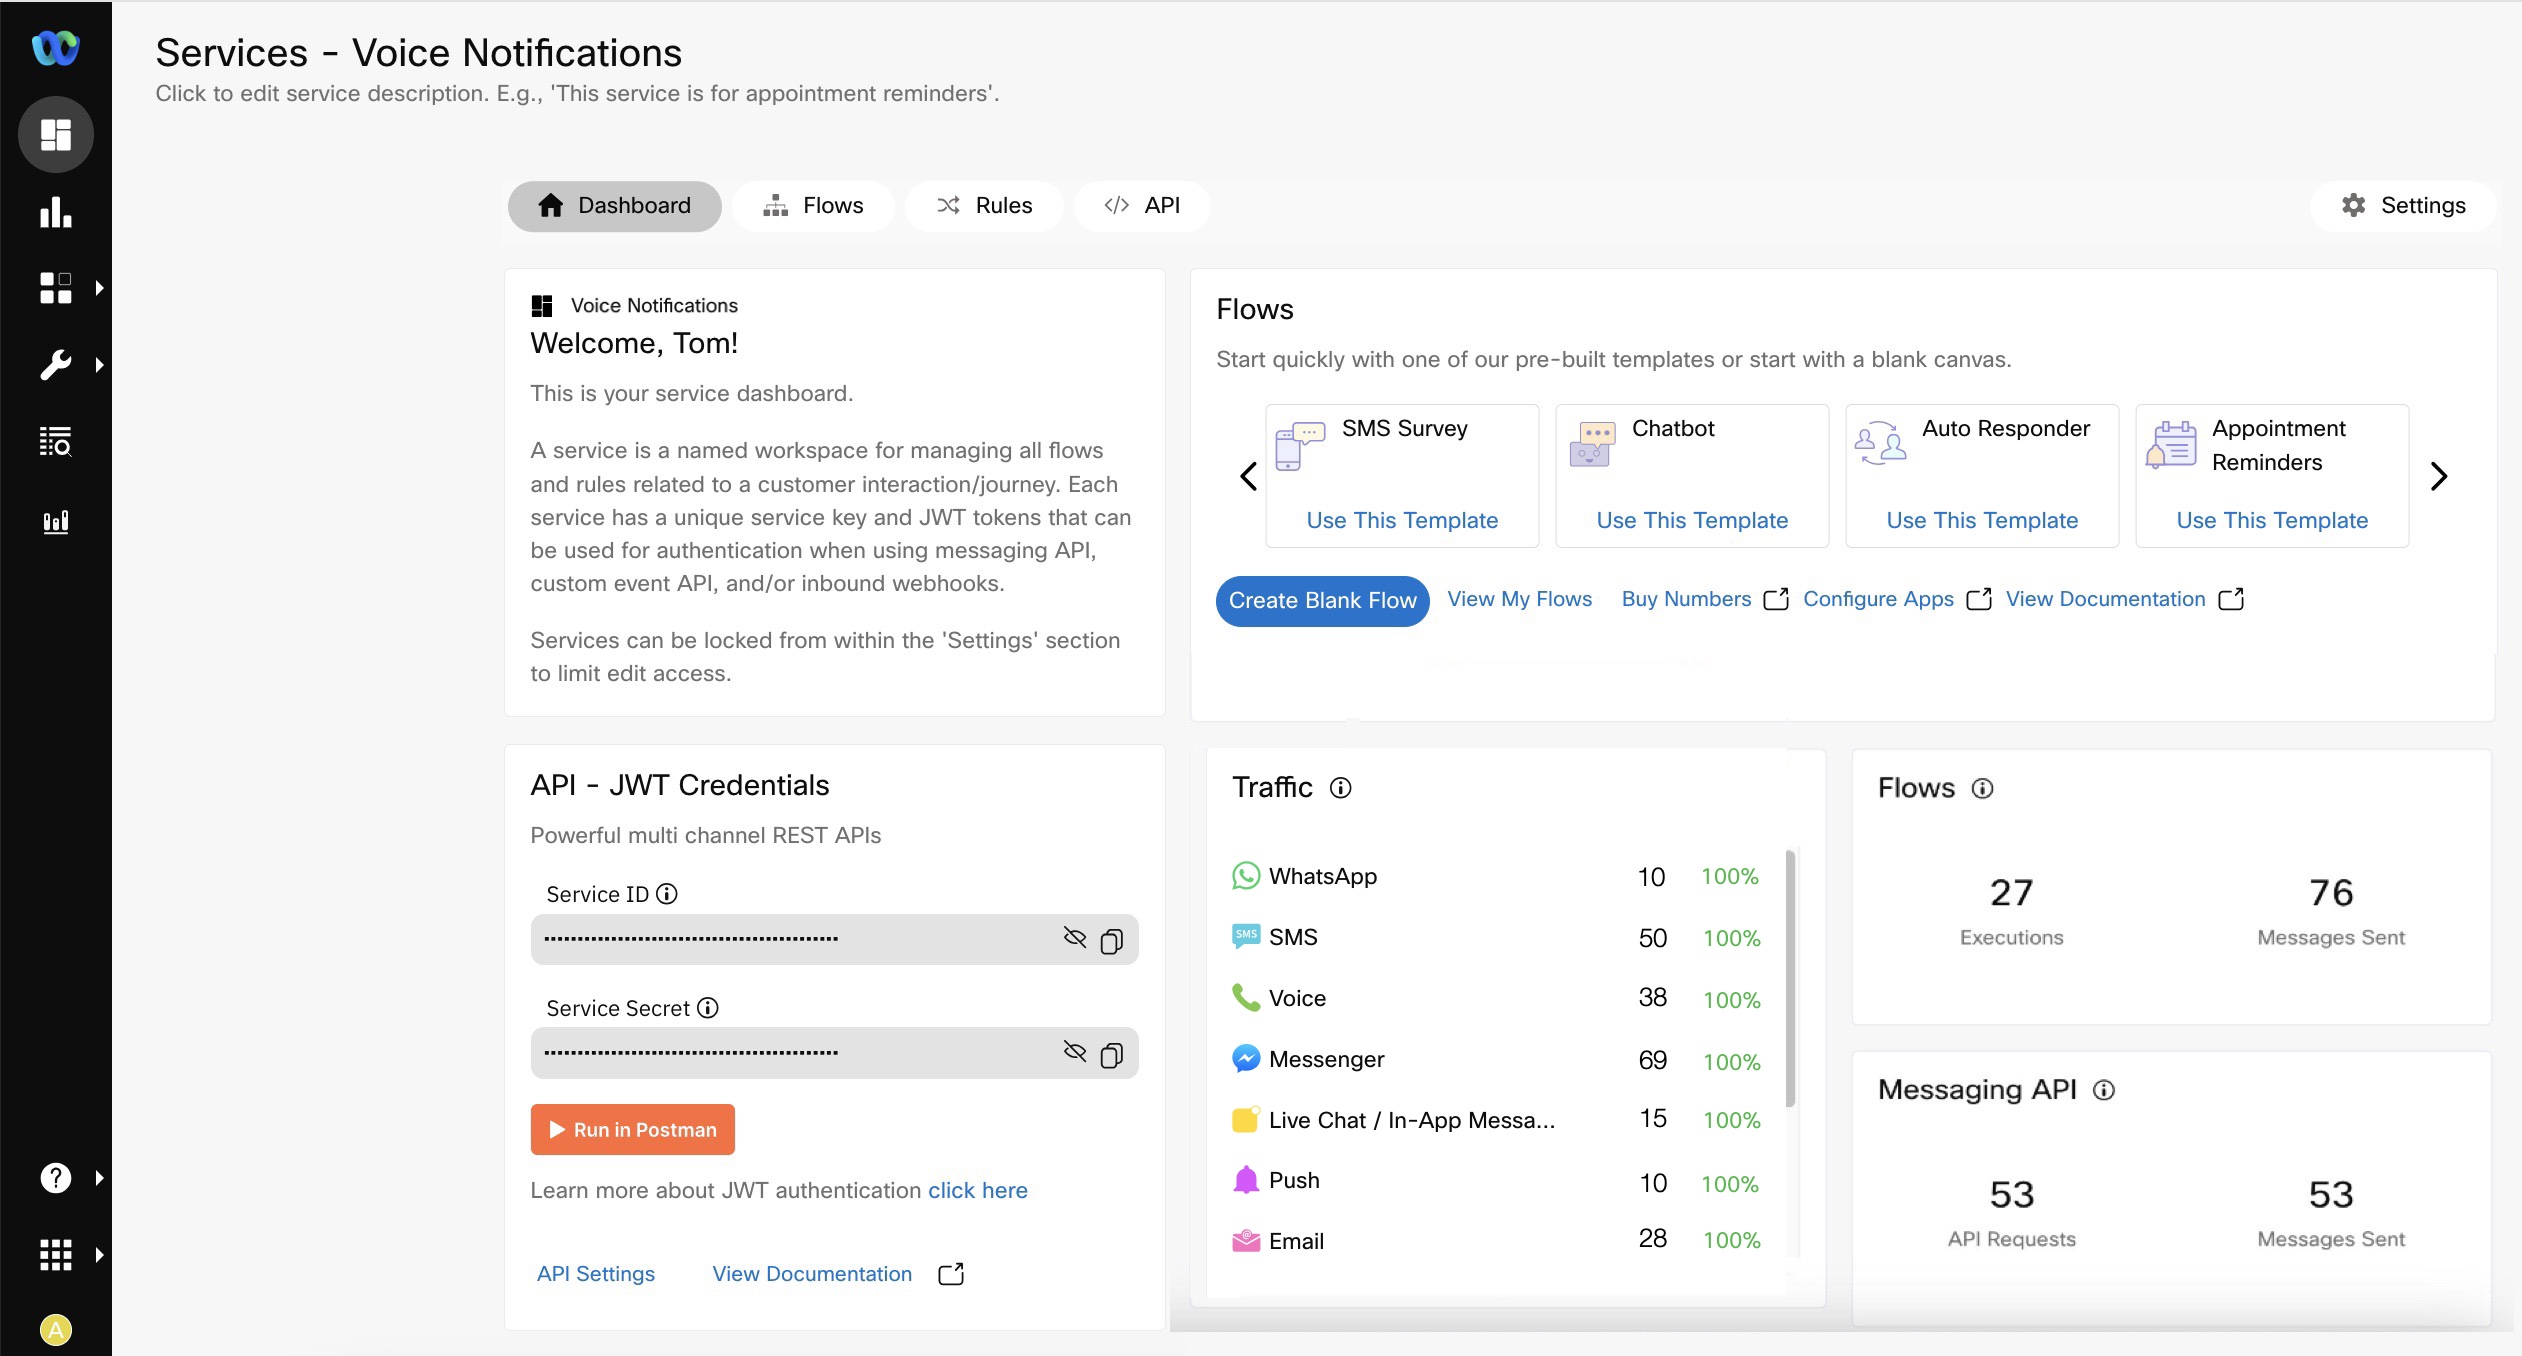
Service Specific Dashboard
To view and analyze detailed reports for any of your services visit the 'Reports' section and select your desired service from the Entity dropdown. Further, select the channel or the flow name and specify the time period you would like to see the reports for. Click Get Reports.
Sample report for SMS channel usage at a service level.

Service Level Report for SMS Channel
Following is the information that’s displayed as part of the reports:
- Total Requests - Number of requests submitted by the user to the connect platform.
- Requests Submitted - Number of requests submitted by the connect platform to the messaging gateways.
- Requests Scheduled - Number of requests waiting to be submitted by the connect platform to the messaging gateways.
- Requests Rejected - Number of requests rejected by the connect platform.
- Total Messages Submitted - Total count of messages delivered and messages failed to be delivered to the end user.
- Messages Delivered - Total count of messages delivered to the end user.
- Messages Failed - Total count of messages failed to be delivered to the end user.
- Messages Clicked - Number of messages clicked.
Details for other channels are also available in a similar reporting format with some variations keeping in view channel-specific capabilities.
What's multi-part SMS message count
The standard character limit for a single SMS is 160 characters. If you send an SMS message that contains more than 160 characters, the message is split into smaller chunks at the operator end and is concatenated at the device end to form a single message for the recipient. If you send a message that contains 200 characters, the multi-part message count would be 2.
Sample report for a flow within a service.

Sample Report for a Flow within a Service
The above screenshot shows details for a flow with the following data points:
- Number of times the flow was invoked
- Number of flow executions - completed, incomplete, and errors
- Count of flows that were successful vs failed as per user configuration on exit nodes
- Report of custom exit reasons using user defined tags
Flow specific reports can are available in two formats:
- Regular View - flow execution stats as shown in the above image.
- Sankey View - flow usage stats in a Sankey chart.
The following image displays a sample Sankey chart report for a workflow.

A Sample Sankey Chart Report
In this view, a list of saved Sankey charts for each version of the selected workflow appears in the Sankey View pane. Select an entity, a workflow, and the Report Type as Sankey View. Now select the version of the flow for which you want to see the Sankey chart and click View Charts.
Interactive Reports and Insights
As part of the reporting and analytics enhancements to the platform, we introduced a new interactive reports and insights capability in Beta mode earlier this year. This feature provides a richer reporting experience allowing you to analyze your customer interactions better. Some of the key capabilities include:
- Rich data visualisations
- Drill through reports
- Cross highlighting and filtering between report visuals
- Customizable views
- Export report pages as PDF files
- Export summarized data from individual visuals into CSV, XLS files.
This is a controlled beta release. Please reach out to your account manager if you would like to know more about this feature.
Updated about 1 month ago