Analytics
The Analytics section provides graphical representation of key metrics to evaluate the bot performance and its effectiveness. There are custom data filters available on the analytics tab. You can access all the bot data from the dashboard based on the data filtered and for the set time period.
Overview
The overview tab shows the overview of the bot performance in the chart. This information helps to learn where and how to improve.
To generate overview of analytics for a bot:
-
Navigate to the Analytics tab on the left-navigation bar. The Analytics screen appears.
-
Click the Overview tab.
-
Select the bot whose overview you want to view from the list of bots.
-
Choose the data range that is the start date and end date for which the analytics must be displayed. The analytics based on the selected data range and bot are rendered .
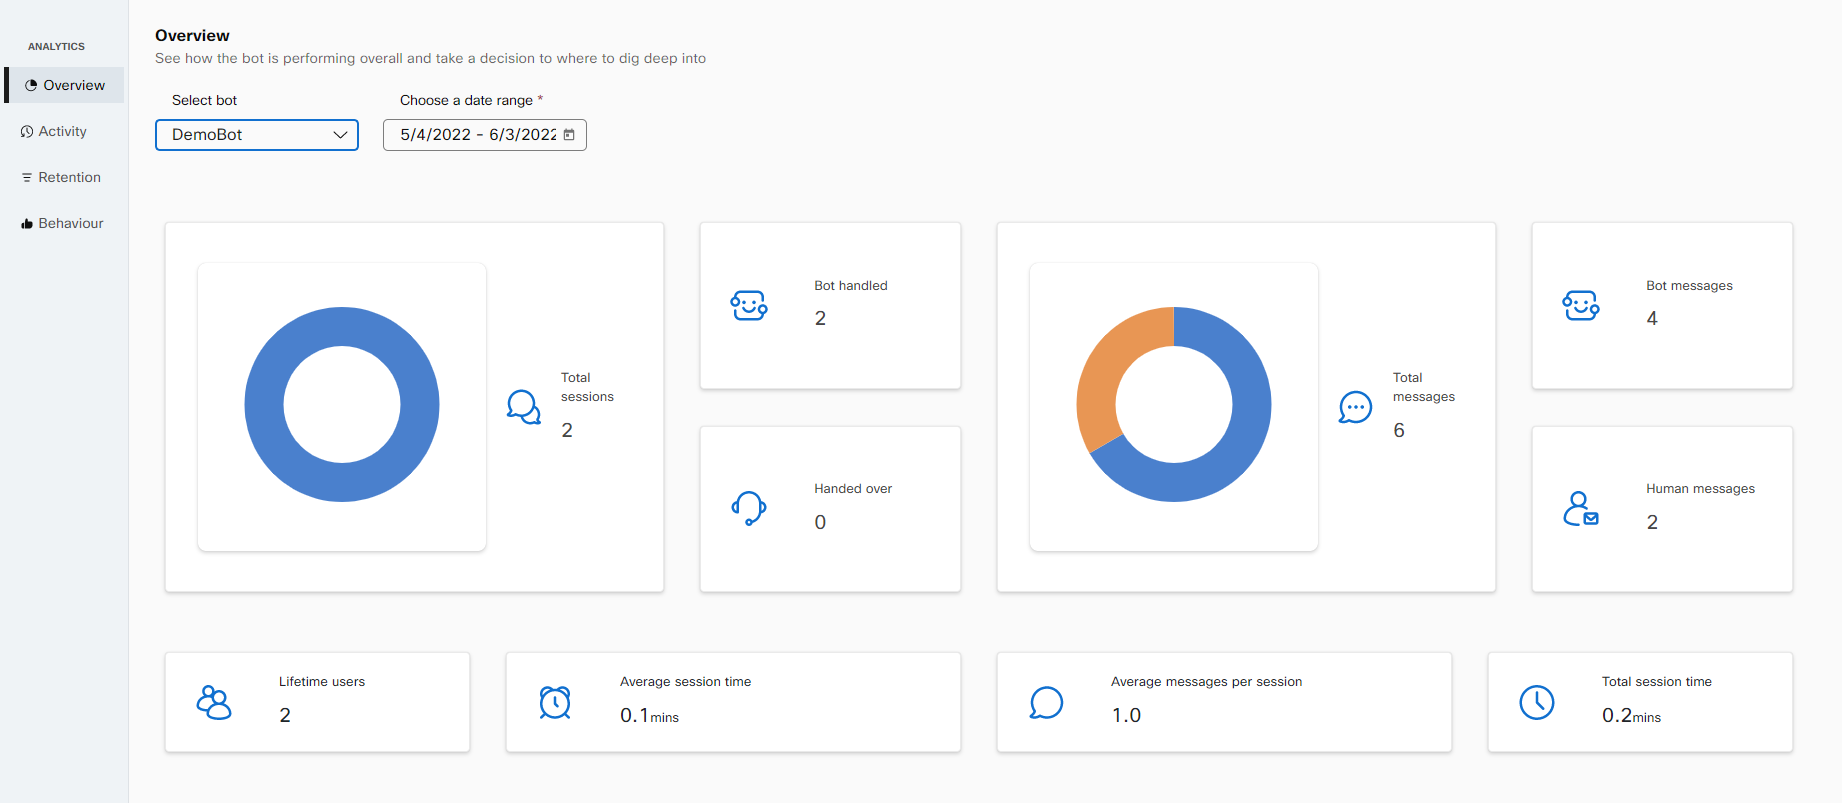
Sessions
- Total sessions - The total number of sessions happened during the selected duration.
- Bot handled- The number of conversations handled by the bot
- Handed over- The number of conversations handed over to a human agent.
Messages
- Total messages- The total messages sent by the bot and user.
- Bot messages - The total number of messages sent by the bot in the interaction happened during the selected period.
- Human messages - The total number of messages sent by human when engaging with the chatbot.
Engagement
- Lifetime users - The users who engaged with the bot.
- Average session time- The average session time for each session.
- Average messages per session - The average messages exchanged between the bot and consumer per session.
- Total session time - The total session time.
Activity
This tab measures the bot performance by consumers, sessions, and messages for the selected time period.
View activity analytics
You must define the search criteria to view the activity chart for the selected duration and bot.
To generate and view activity analytics for a bot:
- Navigate to the Analytics tab from the left navigation menu.
- Click the Activity tab.
- Select the bot of which you want to track the consumers, sessions and messages.
- Select the channel from where the consumer has interacted with the bot.
- Choose the data range for which you want to measure the bot performance.
- Select the Granularity from the list. Possible values:
- Daily
- Weekly
- Monthly
- Yearly
The analytics based on the set search criteria are rendered on the Activity screen.
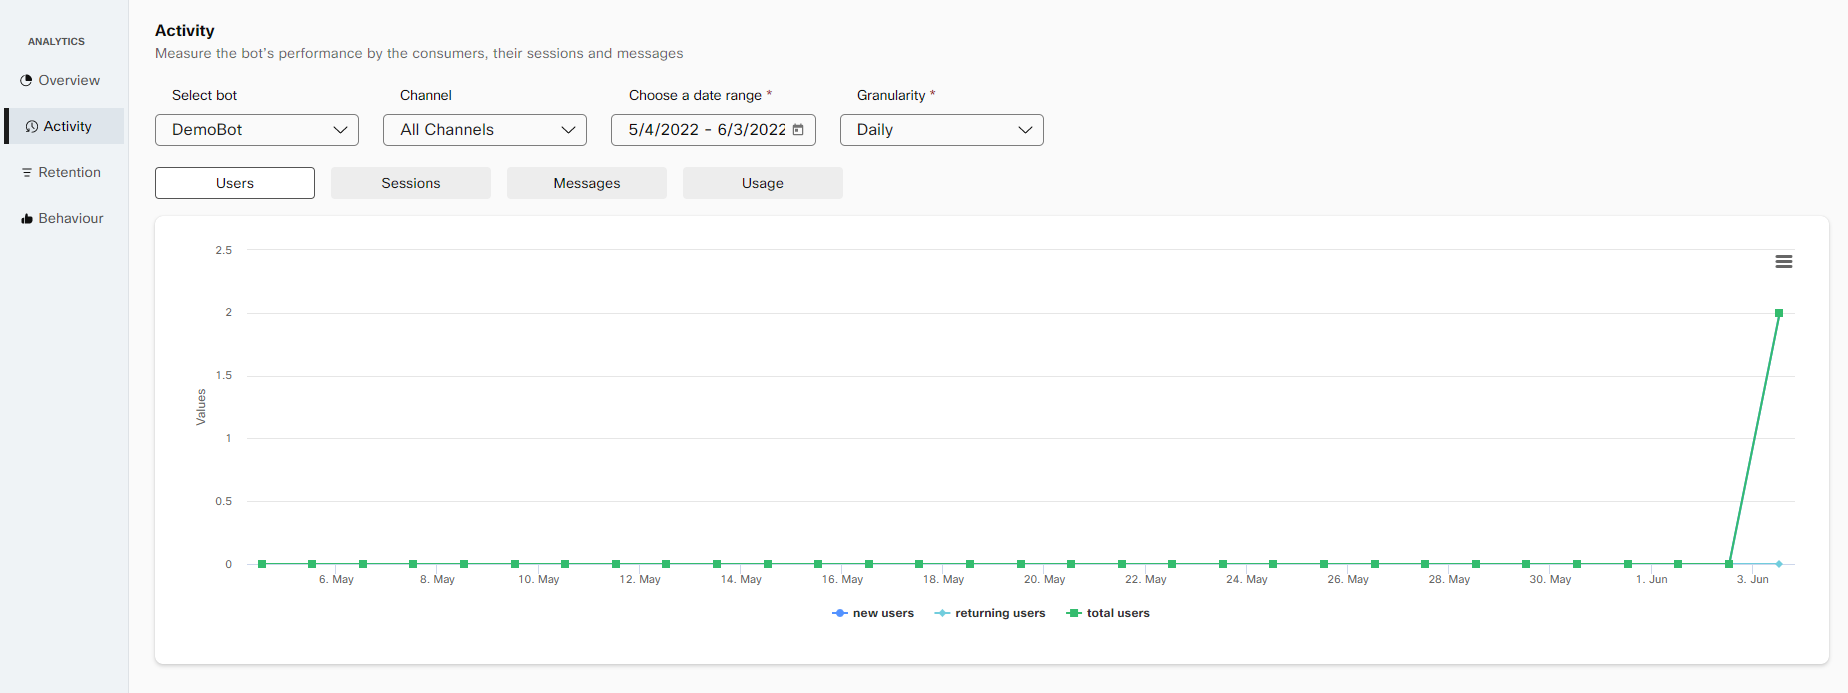
The dashboard organizes the data on these tabs:
• On the Users tab you to view the number of new, reprising, and total users interacted with the bot. The tab also represents the new users, returning users and total number of new and returning users in different colors on the chart.
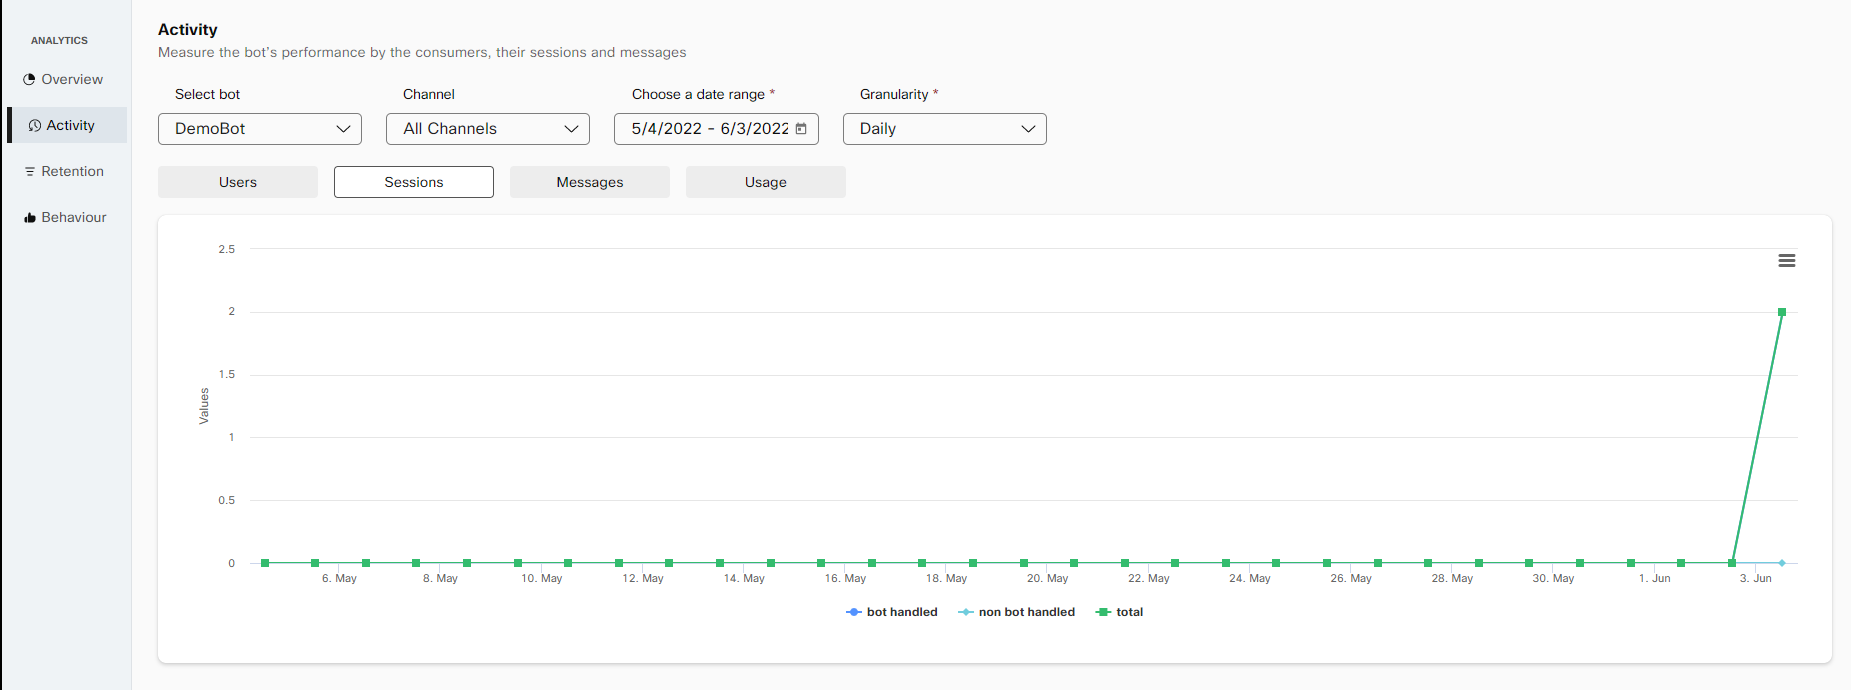
• On the Sessions tab you can view the total session handled by bots and human agents. The tab also shows the bot and non-bot handled sessions in different colors.
• On the Messages tab provides the number of messages sent by the bot and users, and total messages that are exchanged between the bot and user. The tab also shows the total messages handled by bots and humans and the number of messages exchanged between bots and consumers individually.
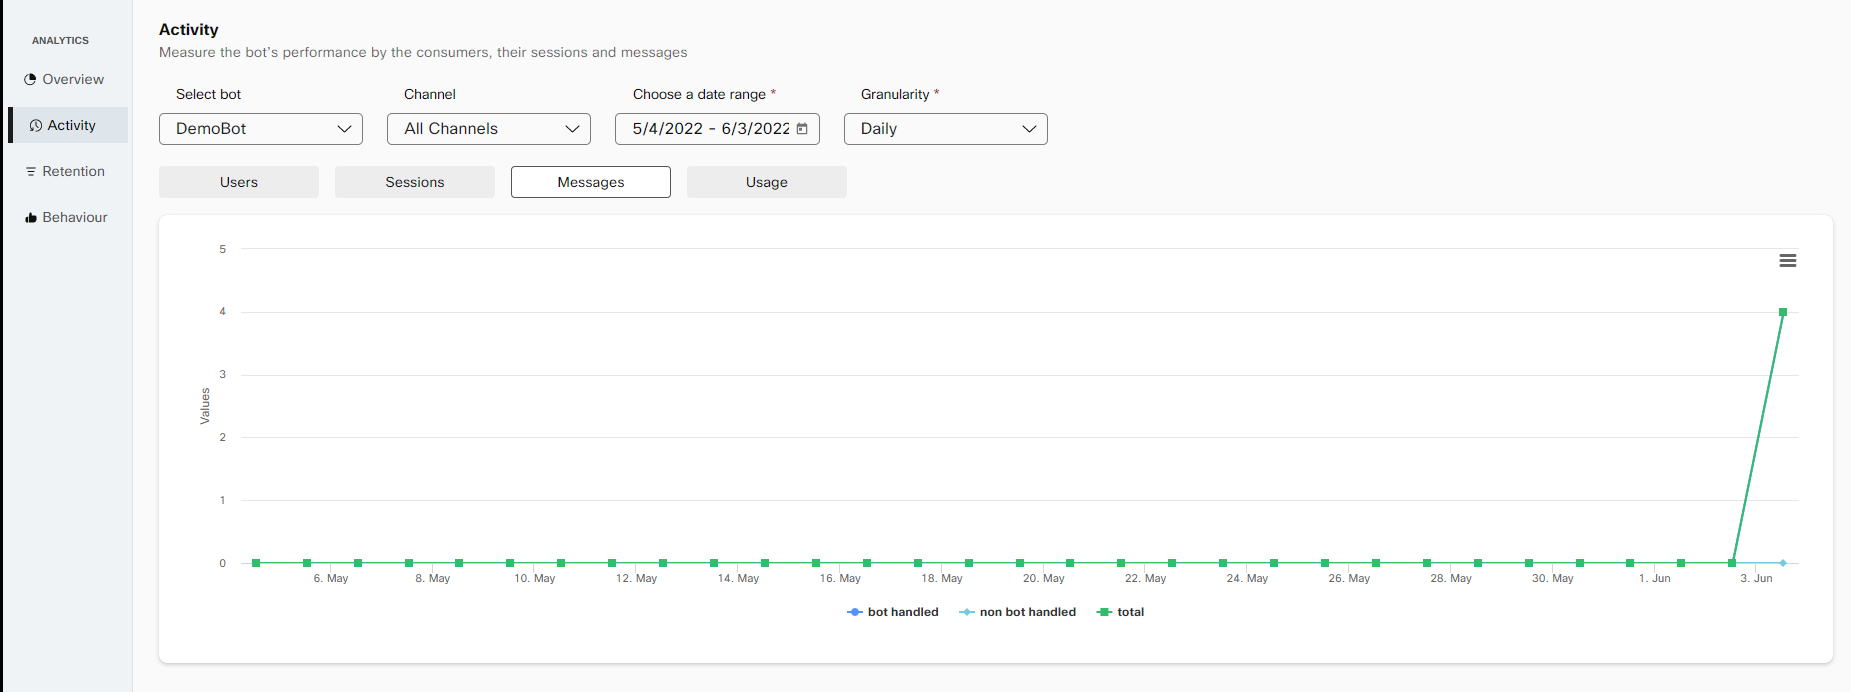
You can also do the following from the hamburger menu on the chart:
- Print the Activity chart by selecting the Print chart option.
- Download the Activity chart in the PNG format by selecting the Download PNG image option.
- Download the Activity chart in the JPEG format by selecting the Download JPEG image option.
- Download the Activity chart in the PDF format by selecting the Download PDF document option.
- Download the Activity chart as an SVG vector image by selecting the Download SVG vector image option.
- Download the Activity chart data to a CSV file by selecting the Download CSV option.
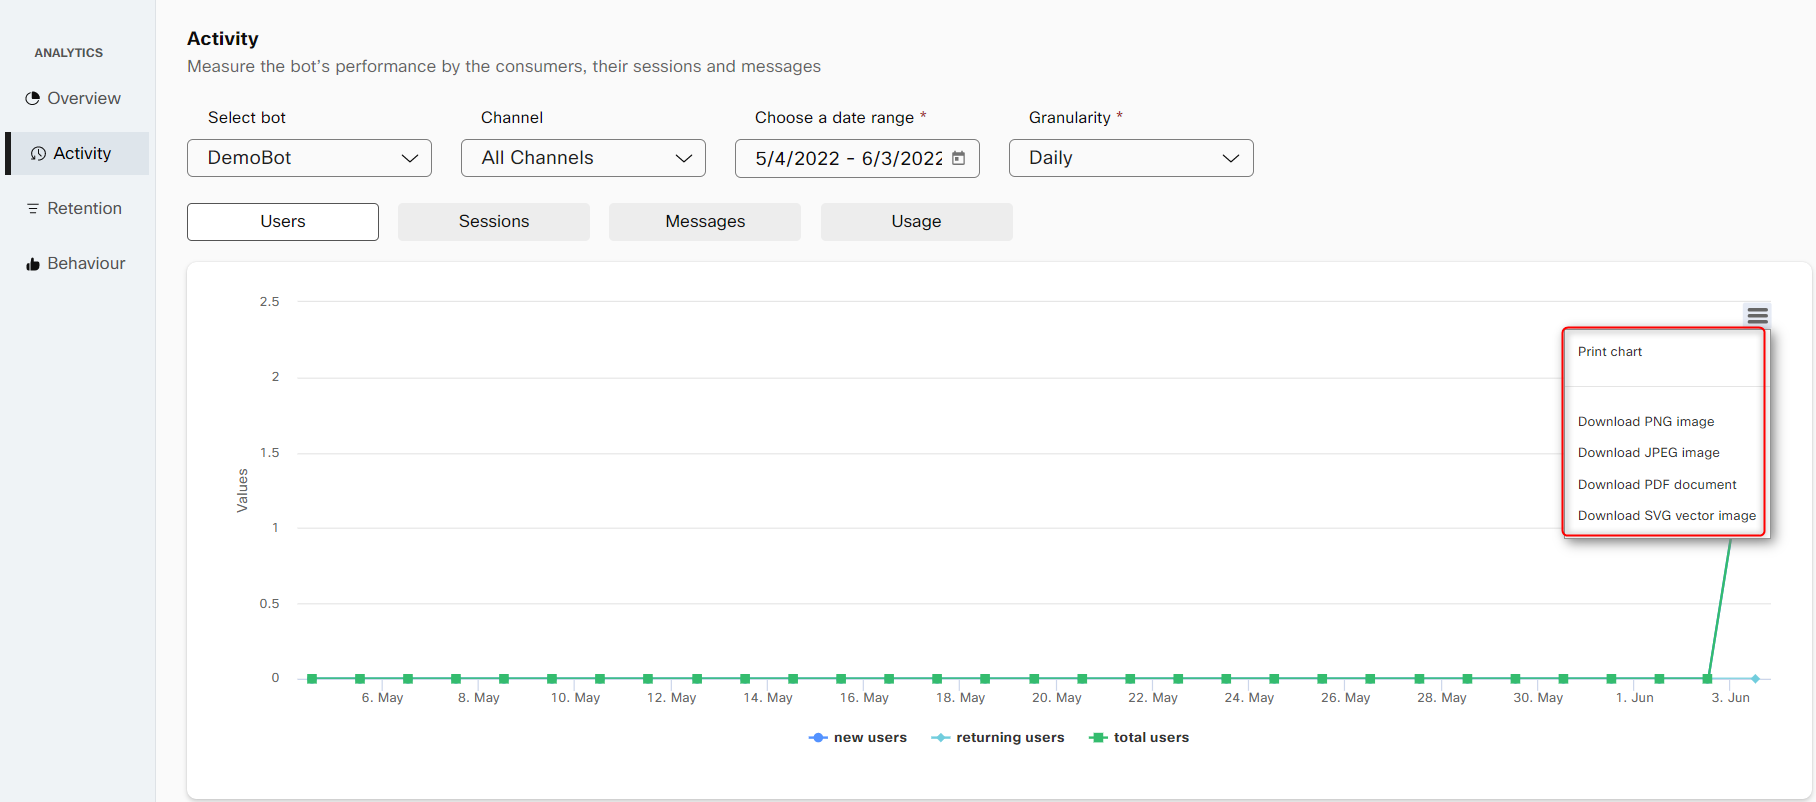
Various formats to print the activity chart
Retention
This tab measures the bot effectiveness on a user and session level for the selected time period.
View Retention analytics
You must define the search criteria to view the retention chart for the selected time frame.
To generate and view retention analytics for a bot:
- Navigate to the Analytics tab from the left navigation menu.
- Click the Retention tab.
- Select the bot for which you want to track the effectiveness at the user and session level.
- Select the channel from where the consumer has interacted with the bot. Possible values:
- All Channels
- WebChat
- Alexa
- Choose the data range for which you want to measure the bot effectiveness.
- Select the Granularity from the list. Possible values:
- Daily
- Weekly
- Monthly
- Yearly
The retention data based on the set search criteria is rendered on the Retention screen.
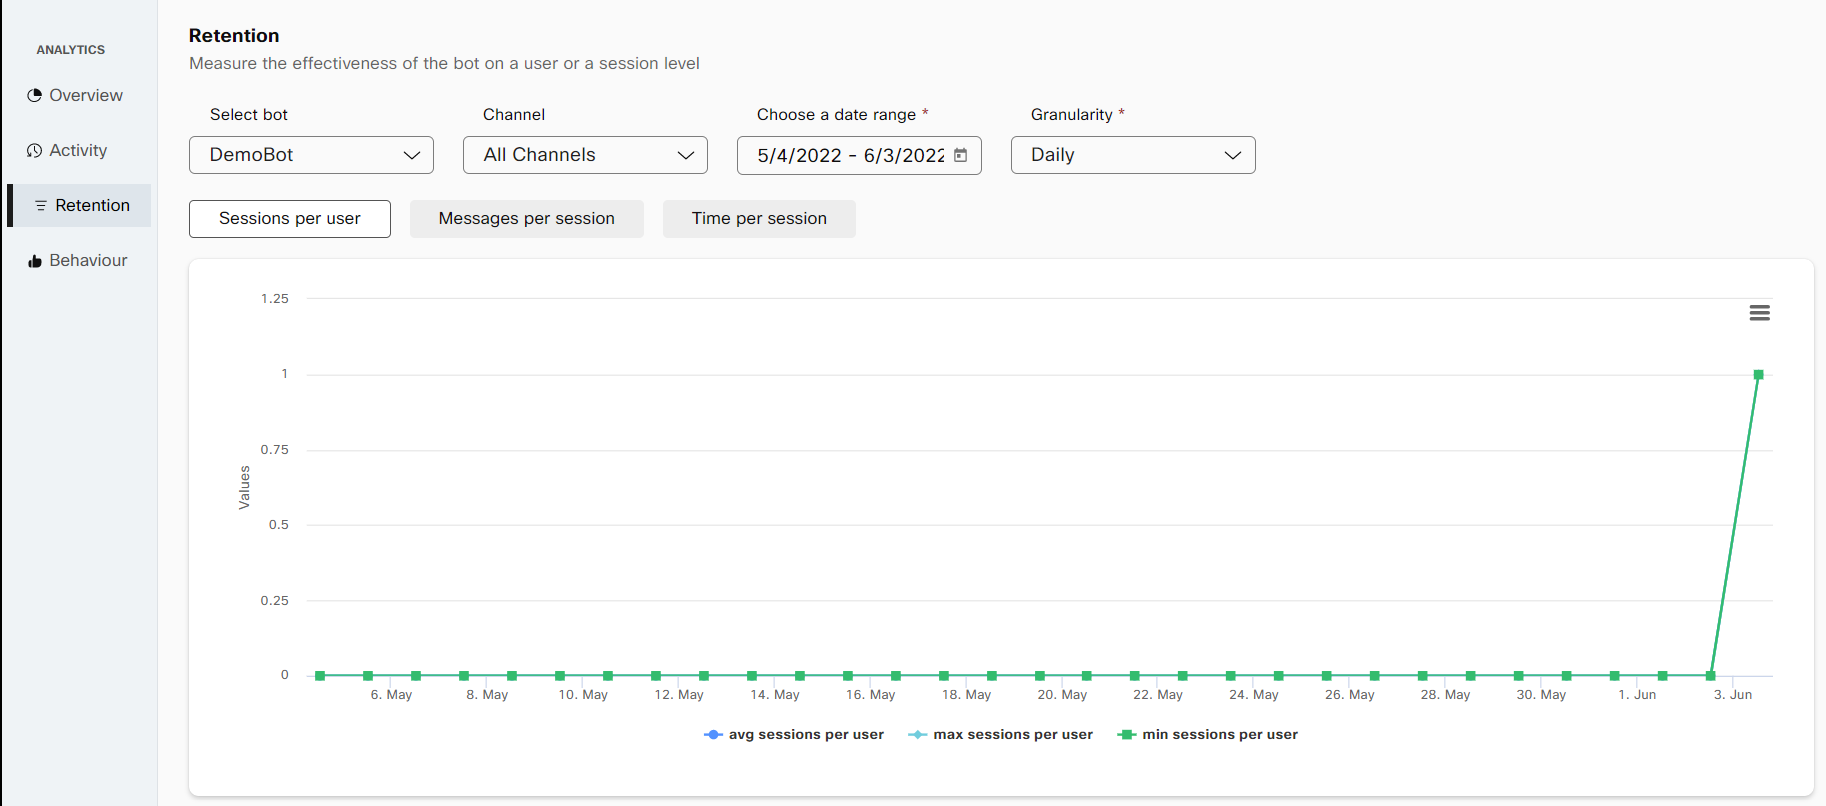
The dashboard organizes the data on these tabs:
• The Sessions per user tab shows data, including average sessions per users, maximum session per users and minimum sessions per users.
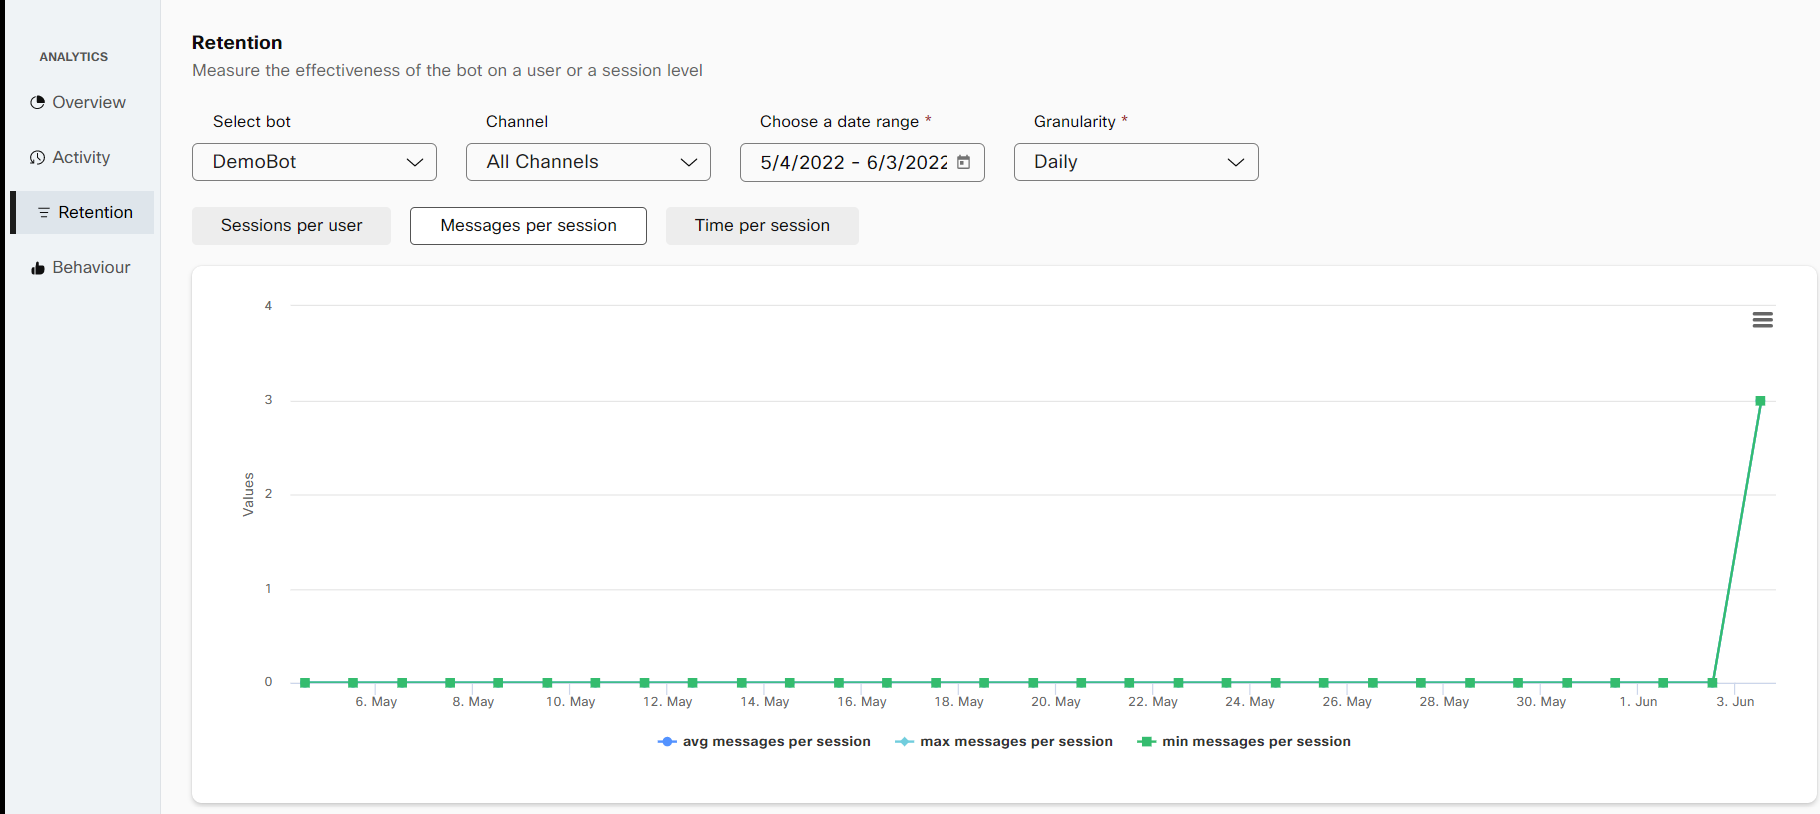
• The Messages per session tab focuses on the maximum and minimum number of messages that were exchanged between the bot and the user in a session. It also provides the average messages per session.
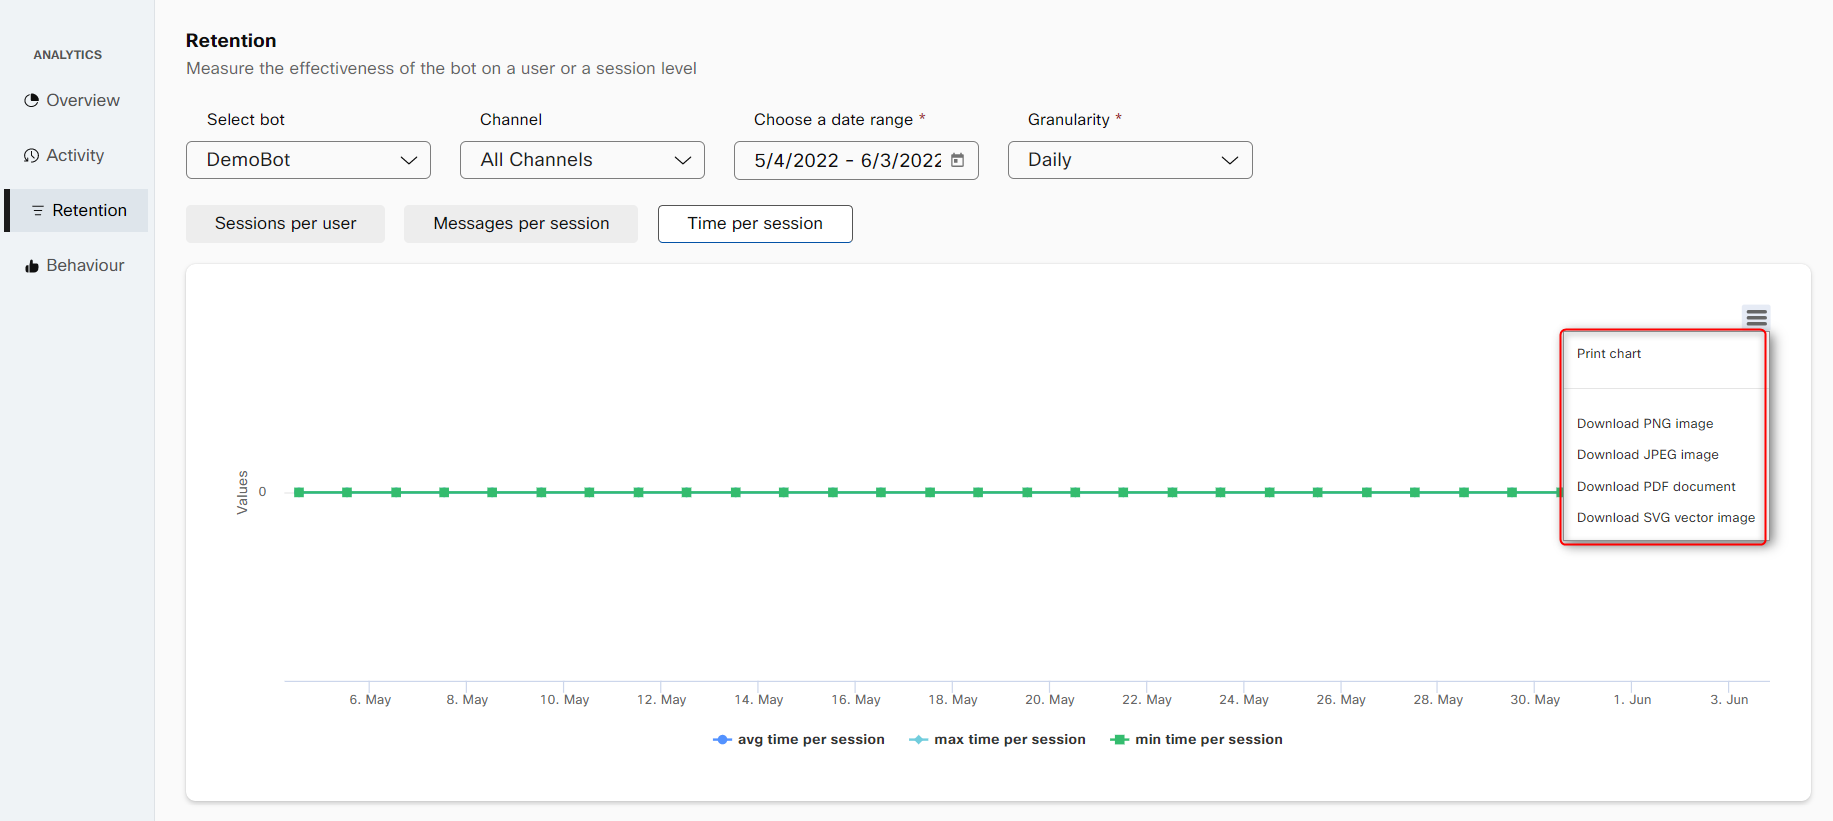
• The Time per sessions tab depicts maximum and minimum length of a session in seconds. It also provides the average time per session.
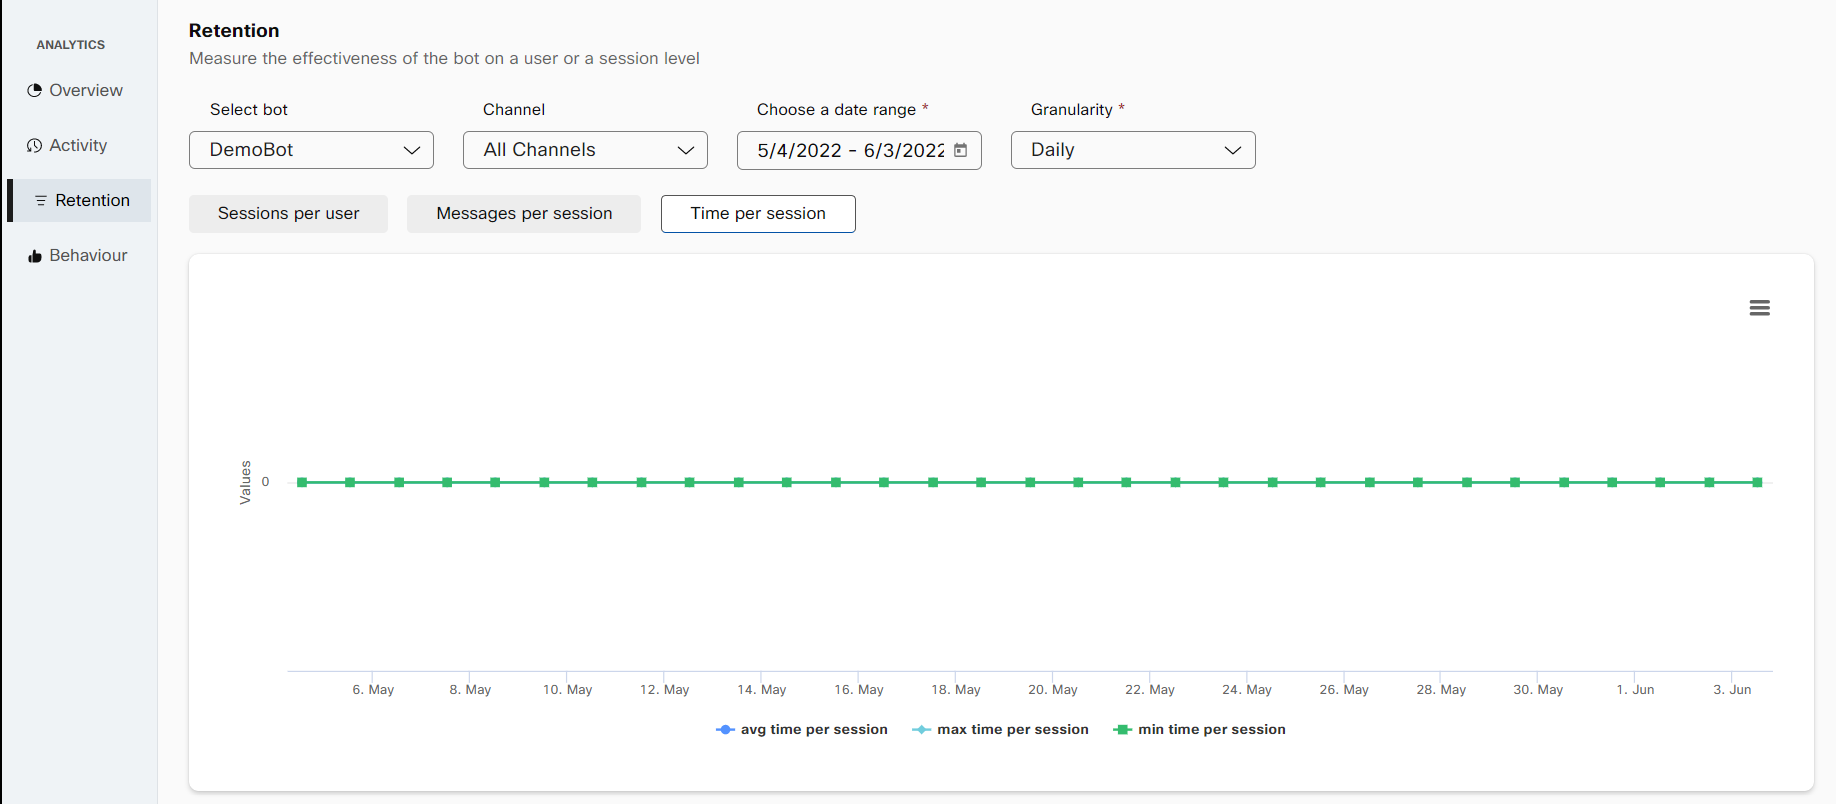
You can also do the following from the hamburger menu on the chart:
- Print the Retention chart by selecting the Print chart option.
- Download the Retention chart in the PNG format by selecting the Download PNG image option.
- Download the Retention chart in the JPEG format by selecting the Download JPEG image option.
- Download the Retention chart in the PDF format by selecting the Download PDF document option.
- Download the Retention chart as an SVG vector image by selecting the Download SVG vector image option.
- Download the Retention chart data to a CSV file by selecting the Download CSV option.
Behavior
This tab shows the queries consumers have asked the chatbot most often, for the selected time period.
View Behavior analytics
You must define the search criteria to view the behavior chart for the selected time frame. The data displayed on the Behavior screen is based on the criteria such as channel, bot, date range and granularity.
To generate and view behavior analytics for a bot:
- Navigate to the Analytics tab from the left navigation menu.
- Click the Behavior tab.
- Select the bot whose behavior you want to track.
- Select the channel from where the consumer has interacted with the bot. Possible values:
- All Channels
- WebChat
- Alexa
- Choose the data range for which you want to measure the bot behavior.
- Select the Granularity from the list. Possible values:
- Daily
- Weekly
- Monthly
- Yearly
The retention data based on the set search criteria is rendered on the Behavior screen.
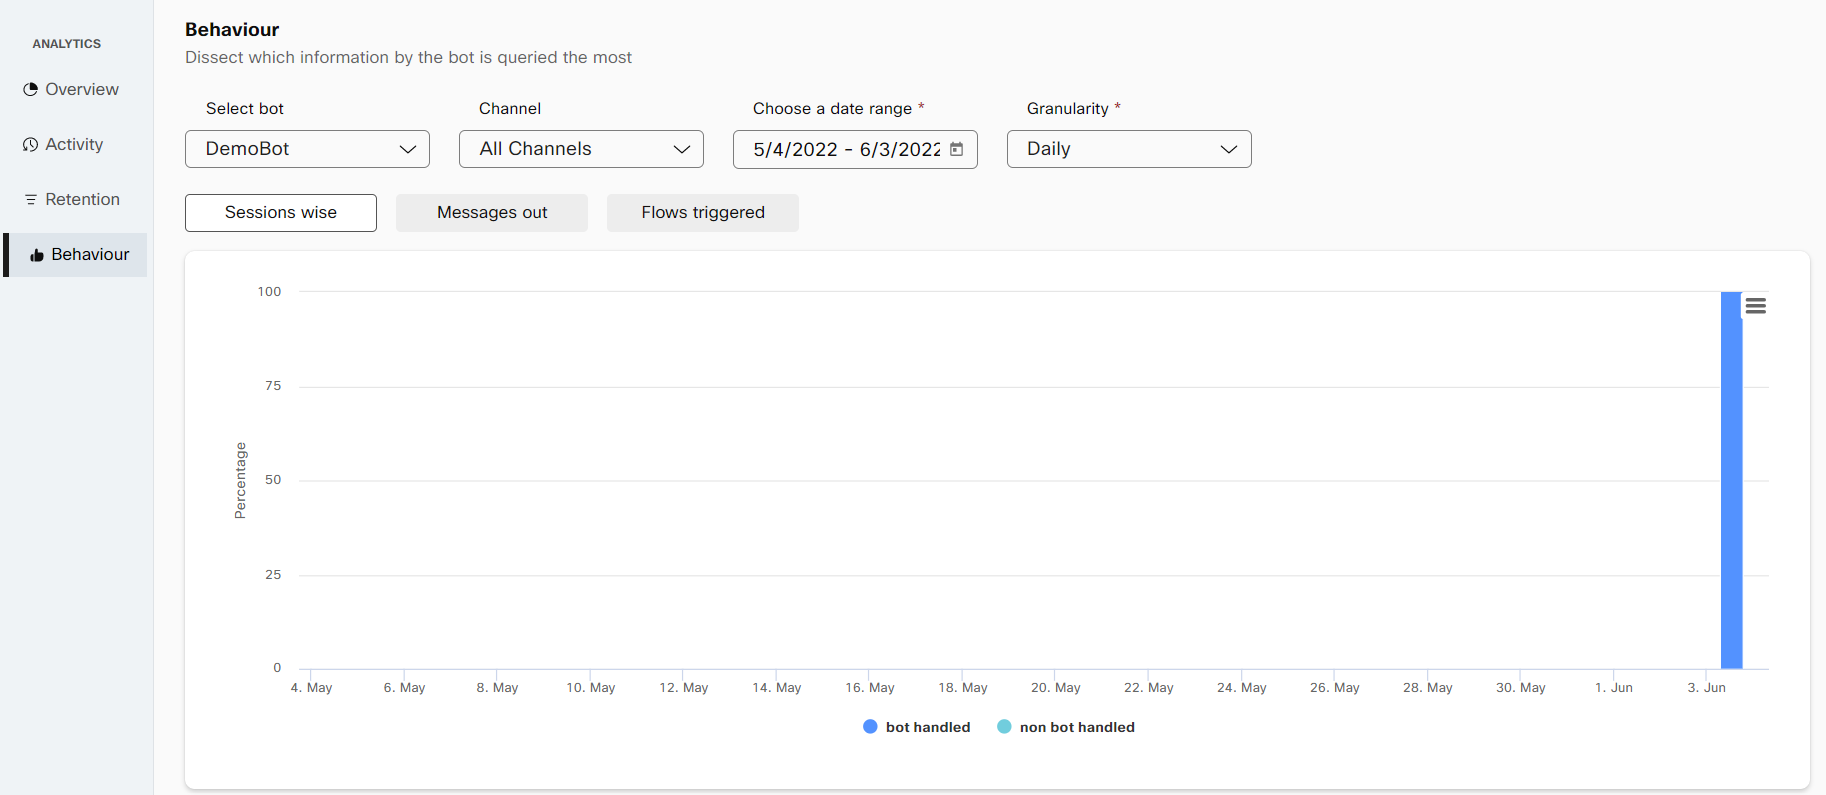
The dashboard organizes the data on these tabs:
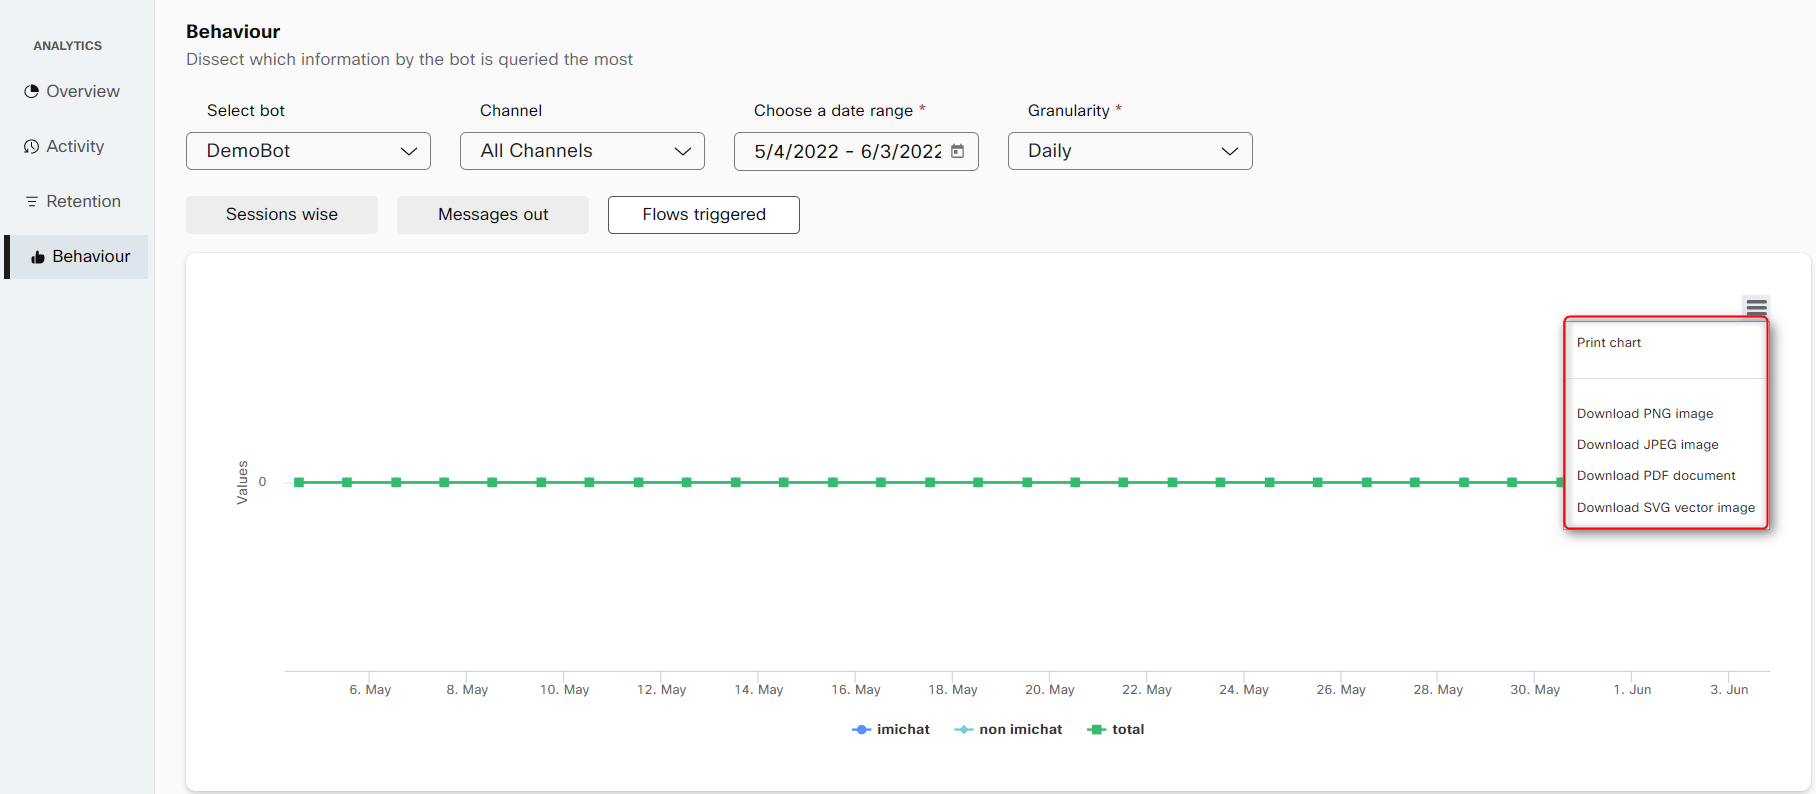
• The Session wise tab gives a summarized view of the sessions handled by bot and human agents.
• The Messages out tab helps you analyze the articles or intents that are invoked by users frequently.
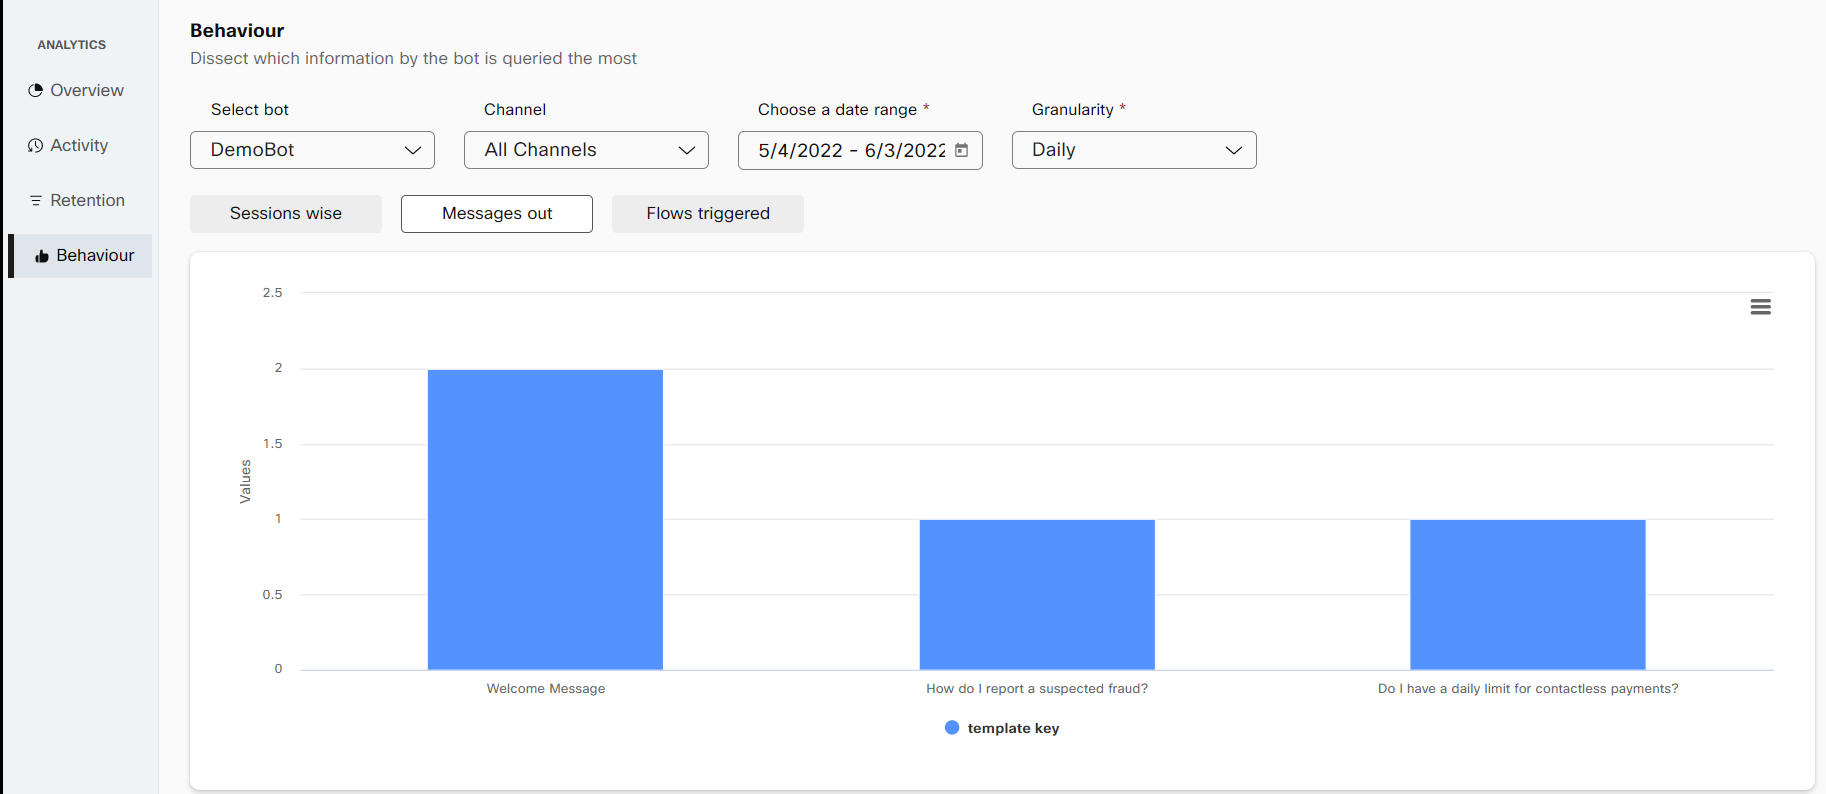
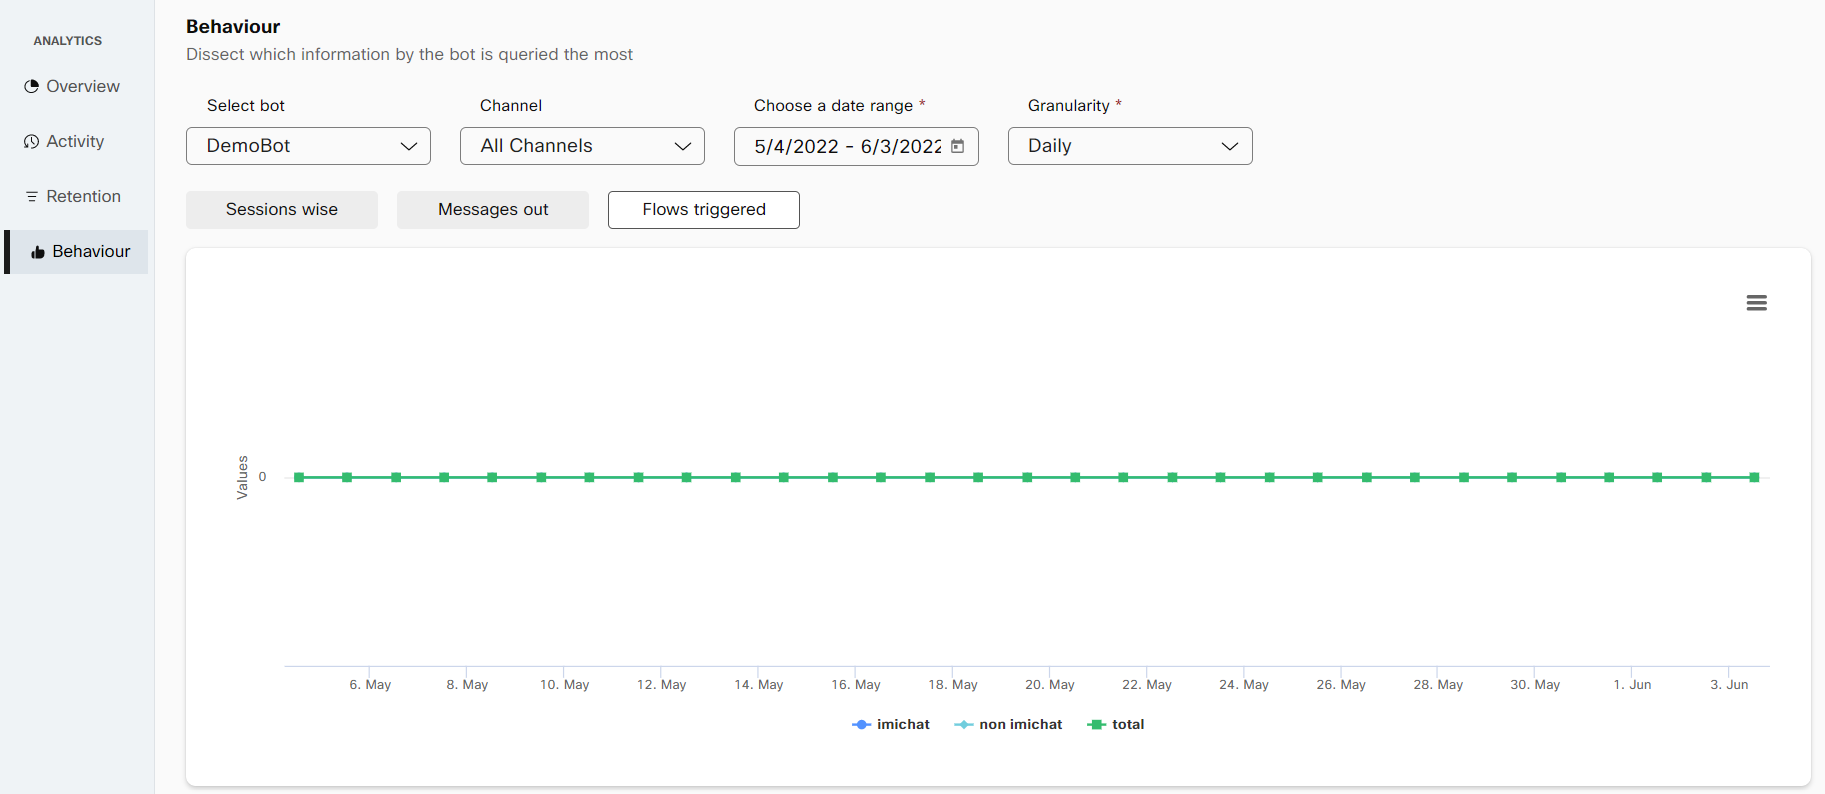
• The Flows triggered tab depicts the number of flows triggered from imichat and imiconnect during the selected date range.
You can also do the following from the hamburger menu on the chart:
- Print the Behavior chart by selecting the Print chart option.
- Download the Behavior chart in the PNG format by selecting the Download PNG image option.
- Download the Behavior chart in the JPEG format by selecting the Download JPEG image option.
- Download the Behavior chart in the PDF format by selecting the Download PDF document option.
- Download the Behavior chart as an SVG vector image by selecting the Download SVG vector image option.
- Download the Behavior chart data to a CSV file by selecting the Download CSV option.
Updated 5 months ago
